© 2026 Followme
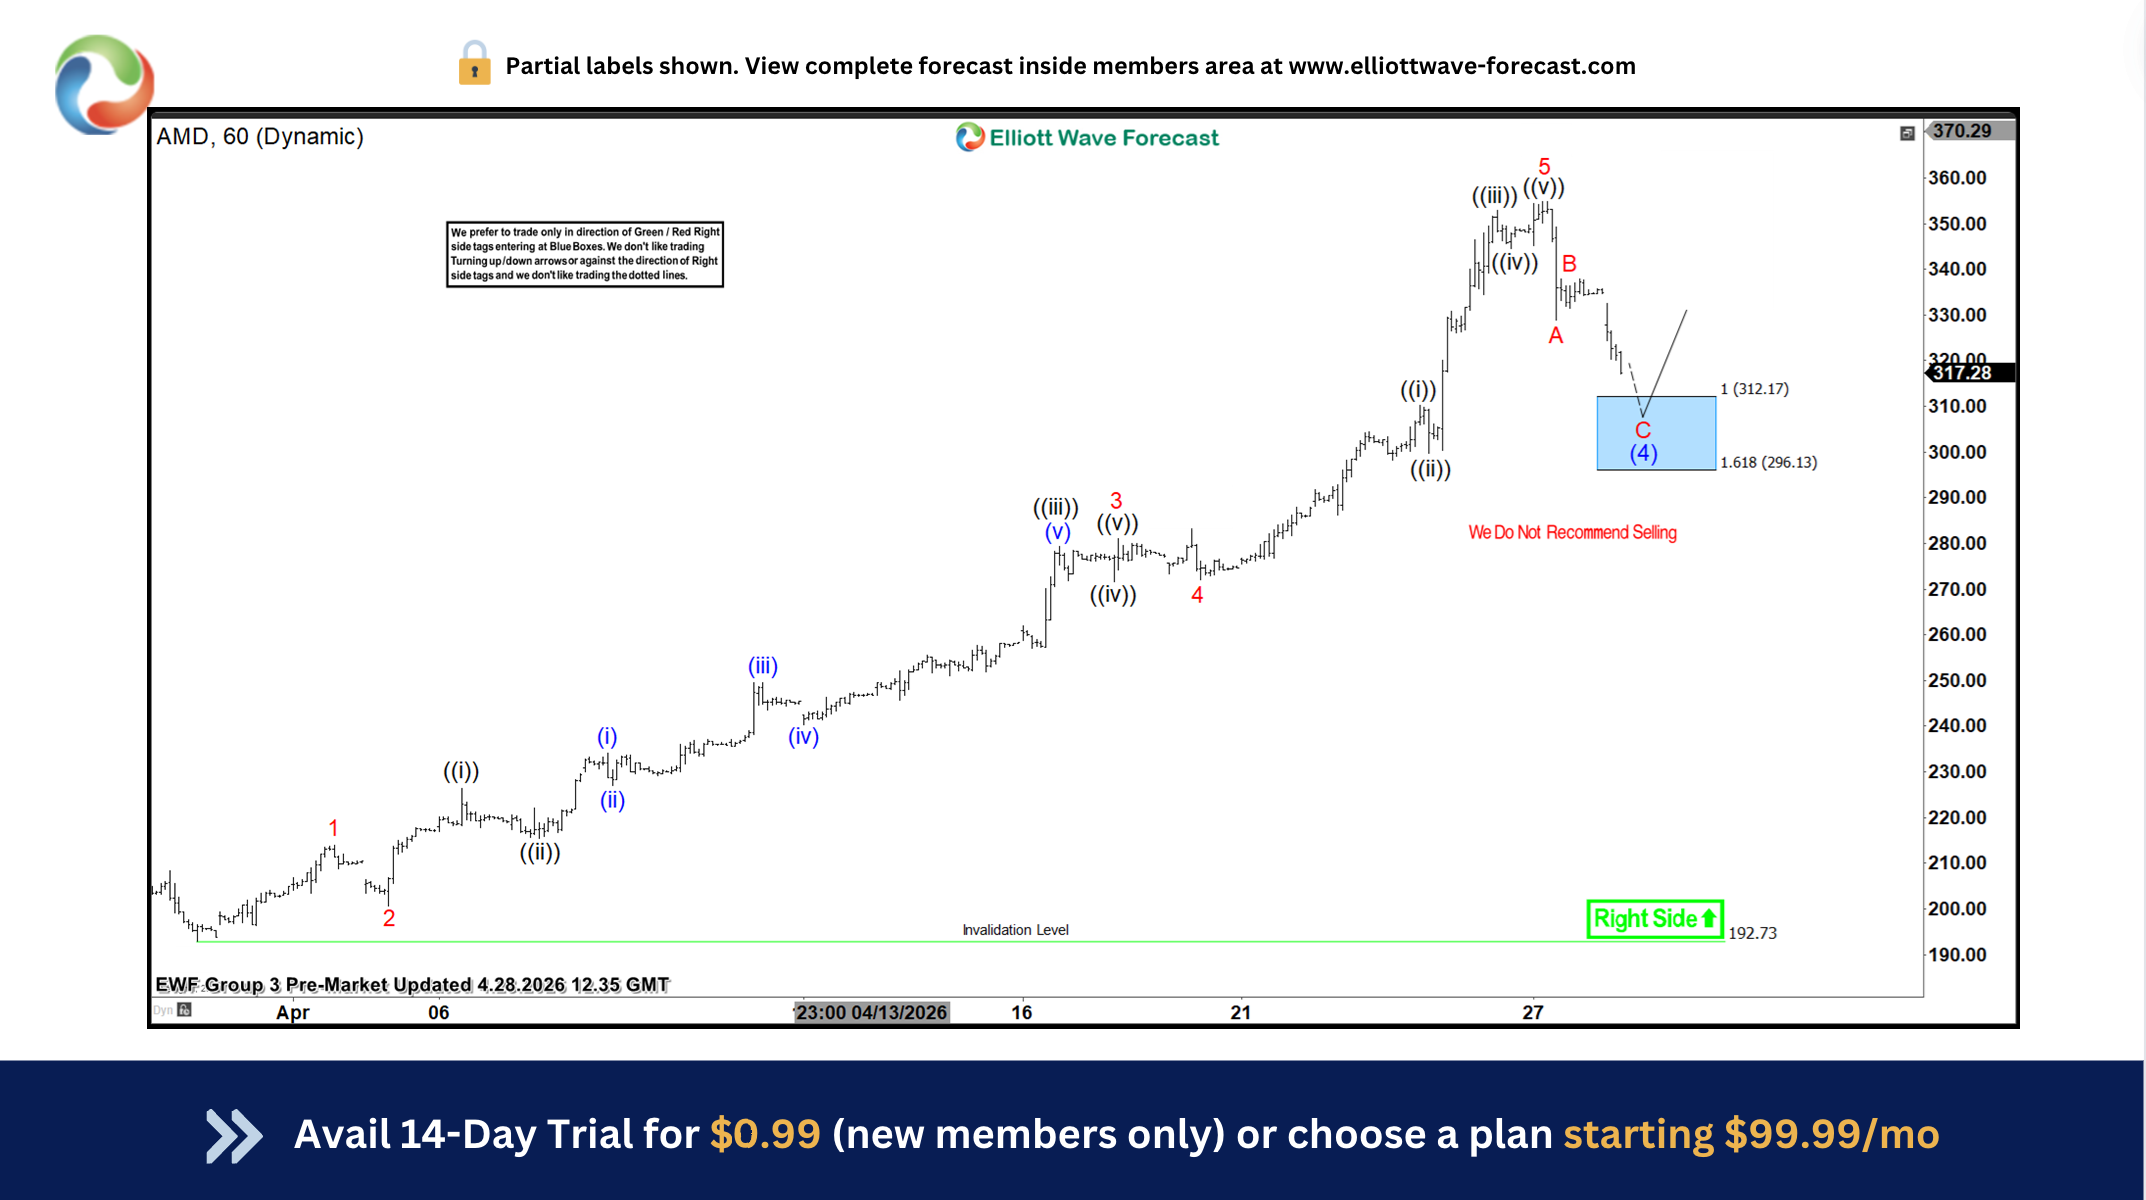
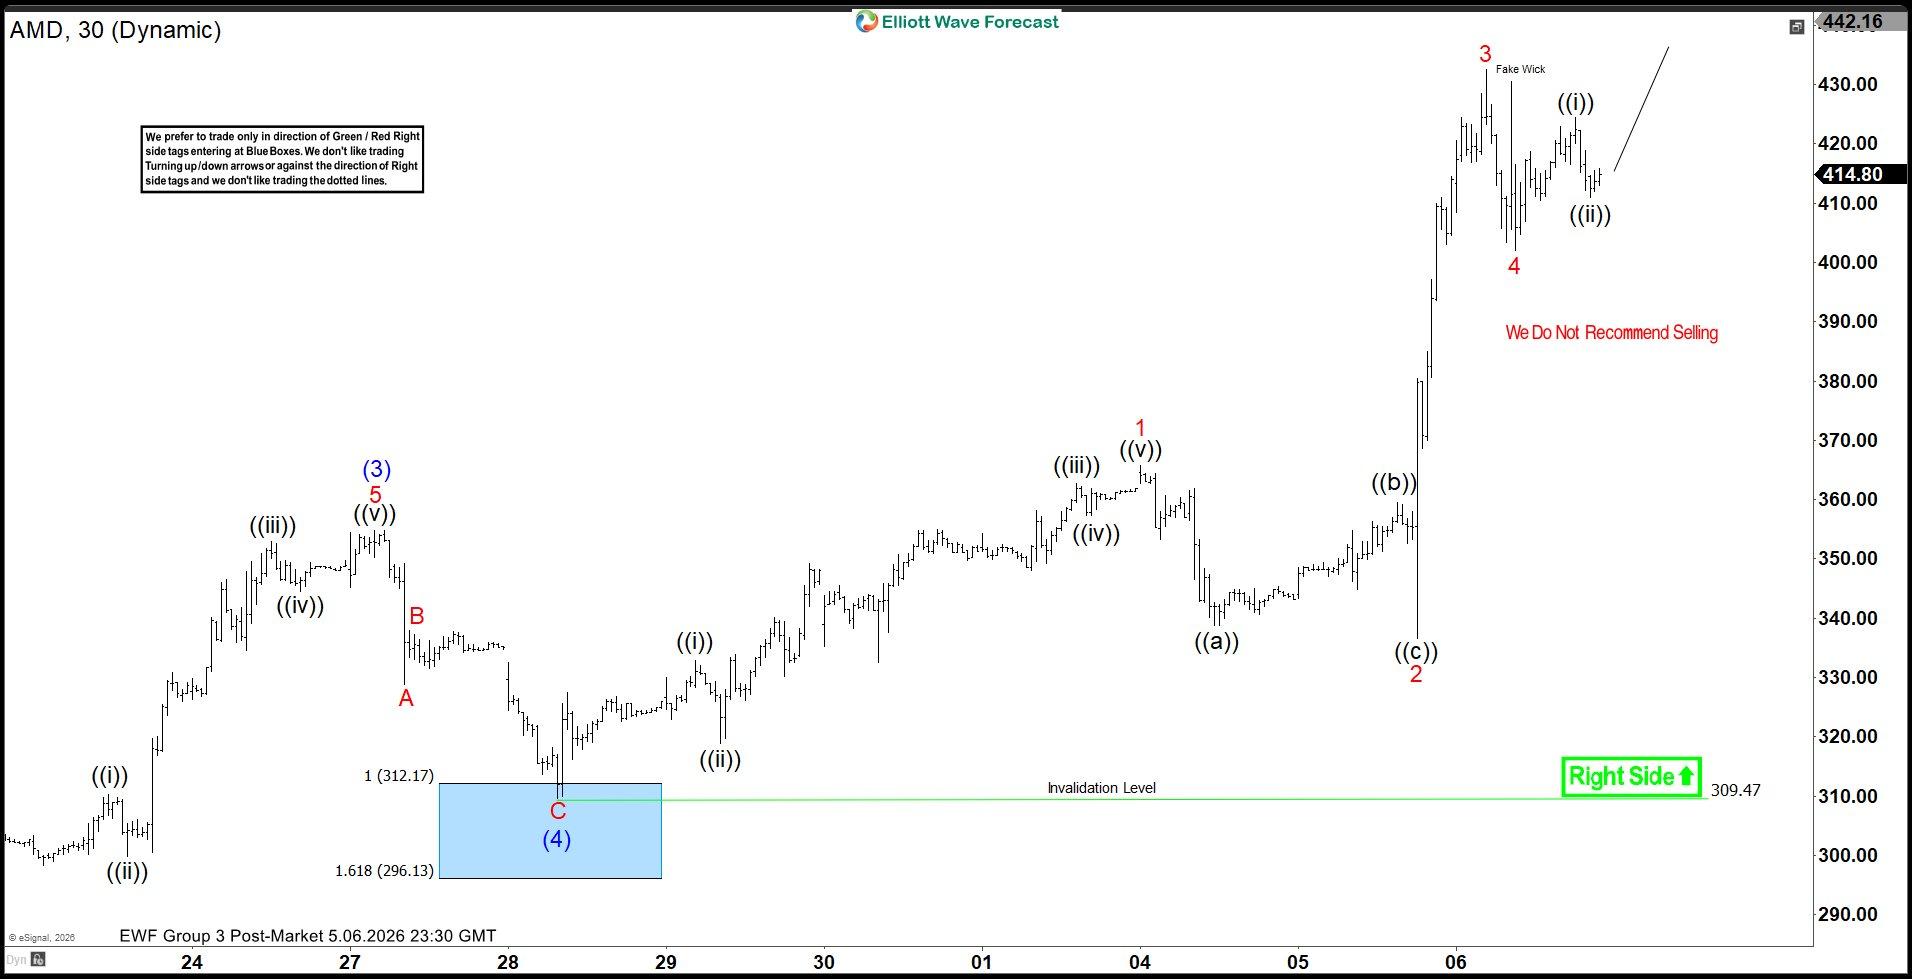
AMD: Surges Over 38 Percent From the Blue box After Earnings Report.
Hello traders, in today’s article we’ll be focusing on $AMD. The stock has surged over 38% from the projected Blue Box area ahead of its earnings report. We’ll examine how the technical structure aligns with the fundamentals, highlighting the relationship between market structure and Fundamentals in
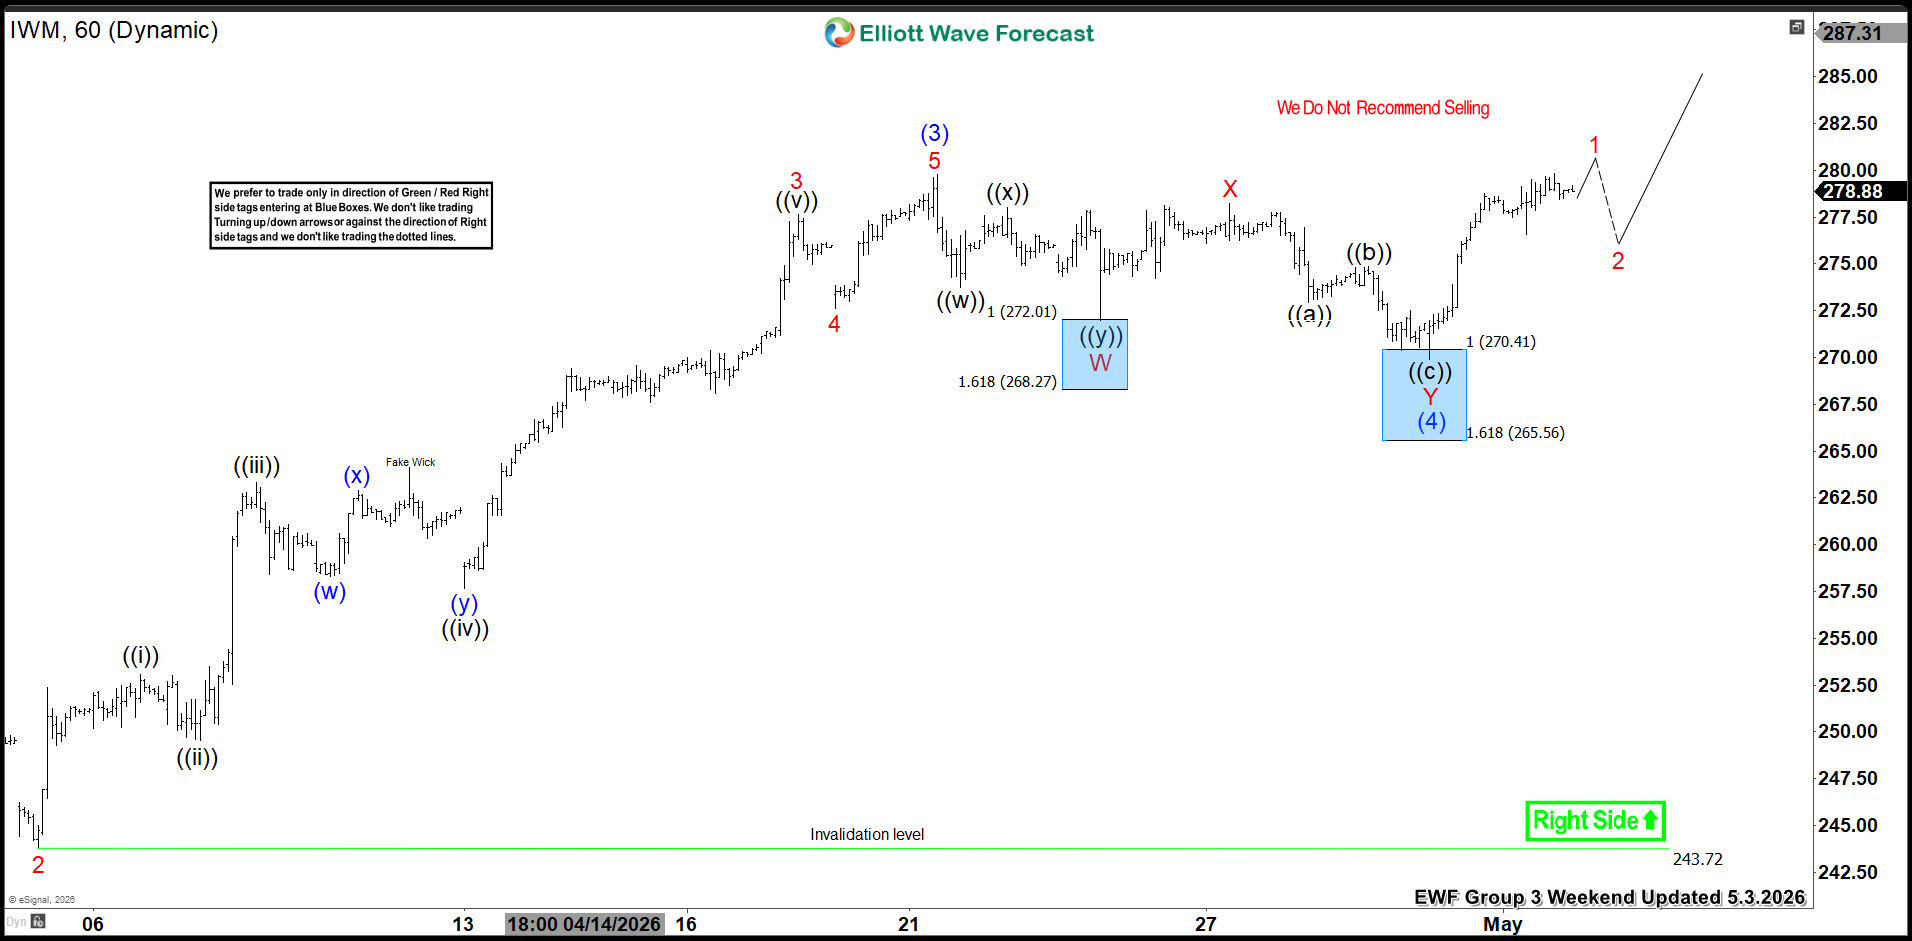
$IWM Reacts Higher From Blue Box After 7 Swing Pullback
In this Elliott Wave update, we look at the latest structure in the iShares Russell 2000 ETF ($IWM). The ETF pulled back in a 7-swing corrective structure and reached short-term blue box areas, where buyers were expected to appear. As anticipated, the market reacted higher from those support zones.
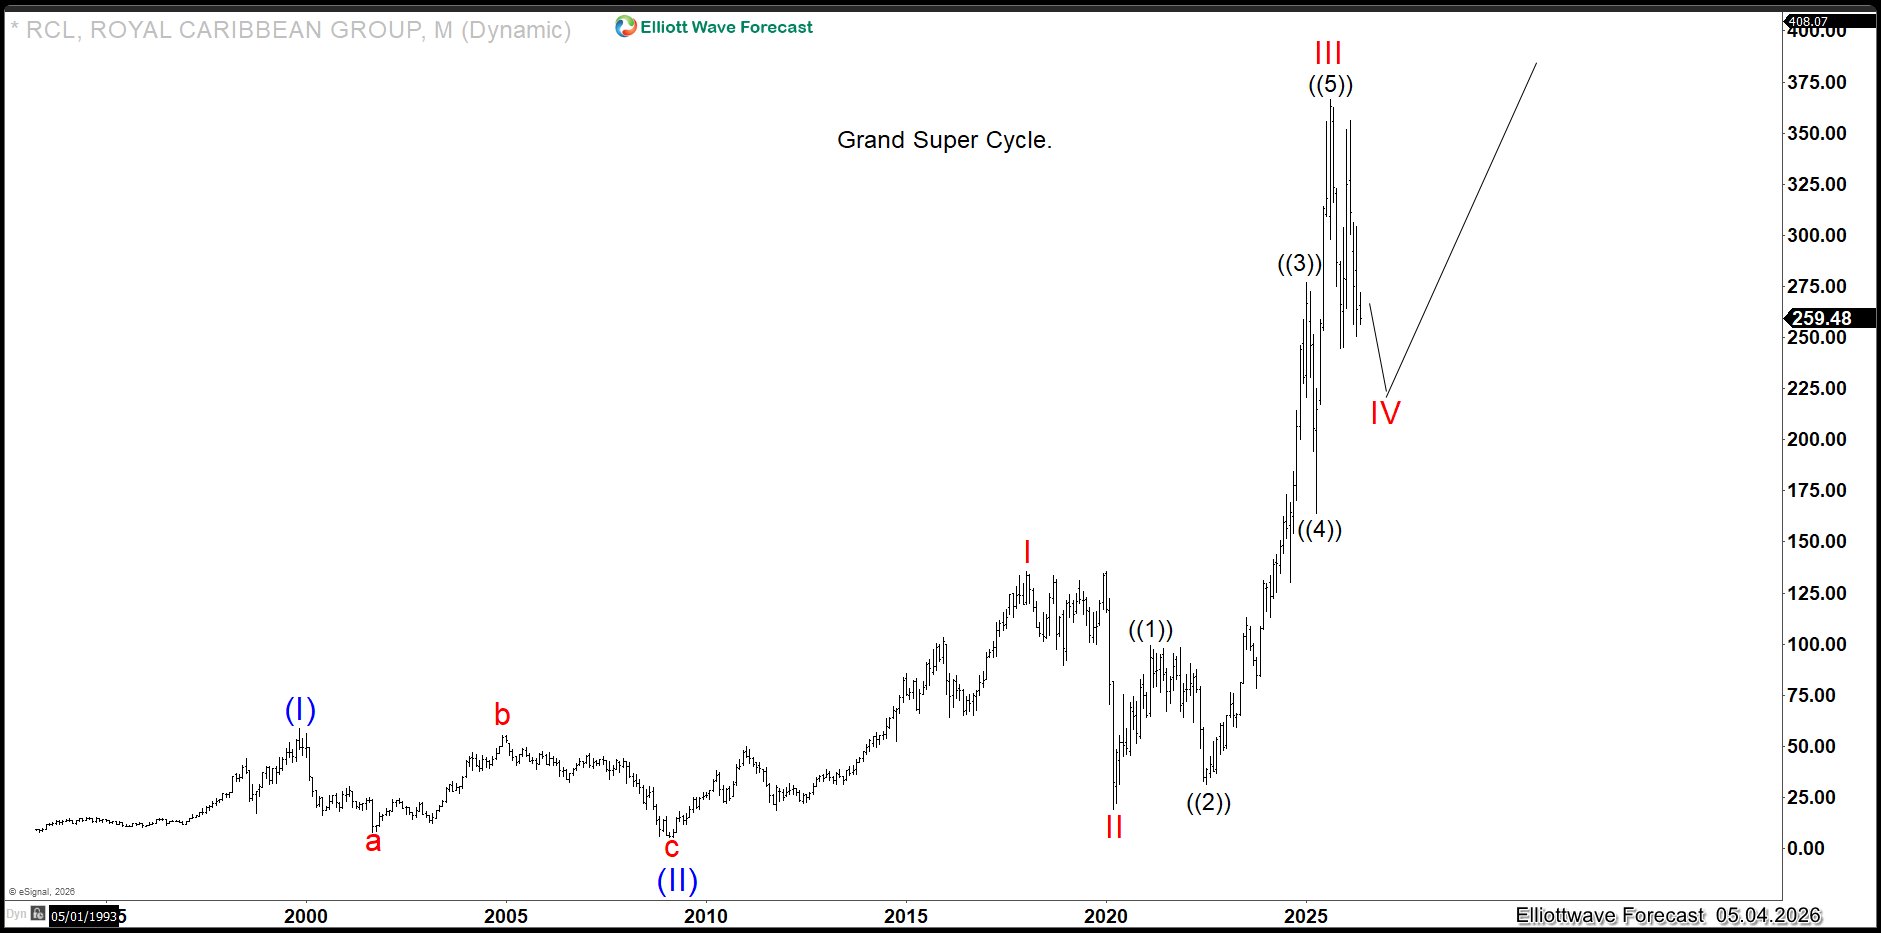
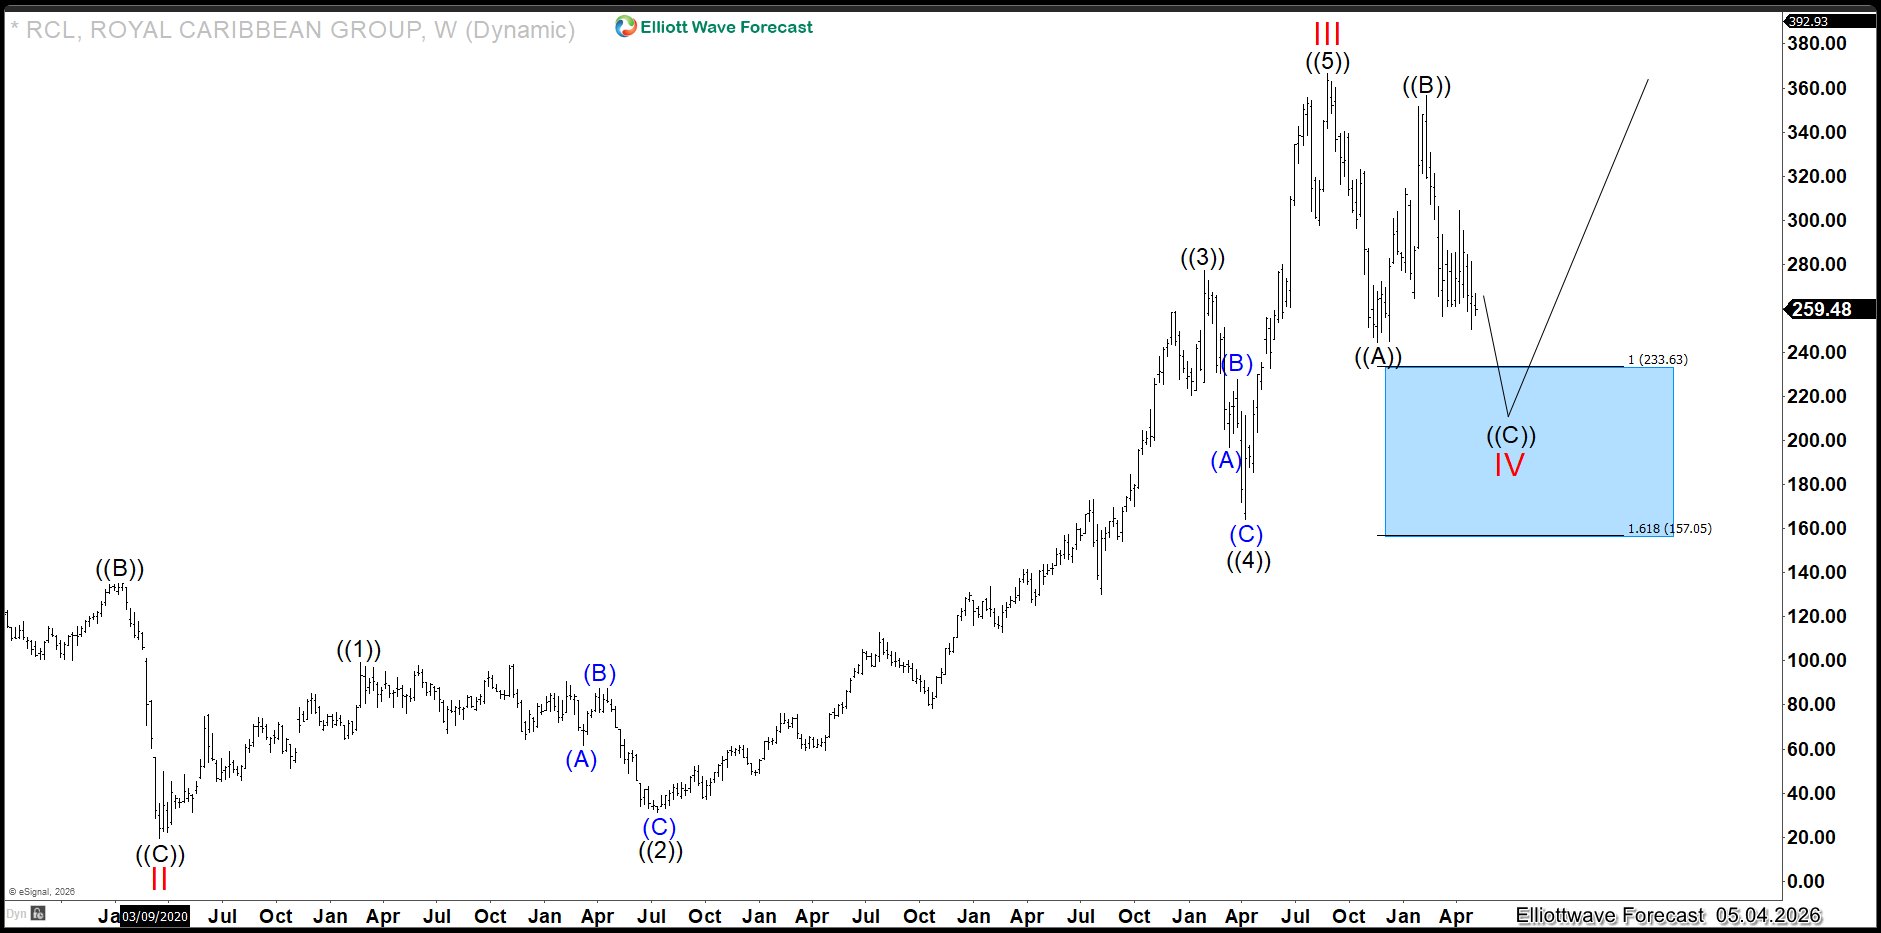
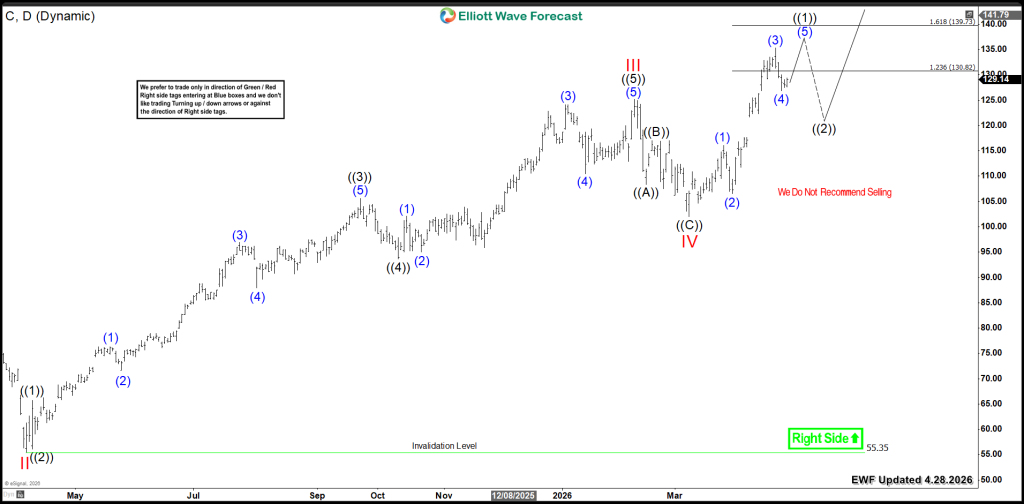
Royal Caribbean (RCL): A $200 Rally is Coming
Royal Caribbean (RCL) presents a compelling case study through the lens of Elliott Wave Theory, particularly when analyzed across both long-term (monthly) and intermediate-term (weekly) structures. The charts outline a classic impulsive advance nested within a larger-degree cycle, with the current p
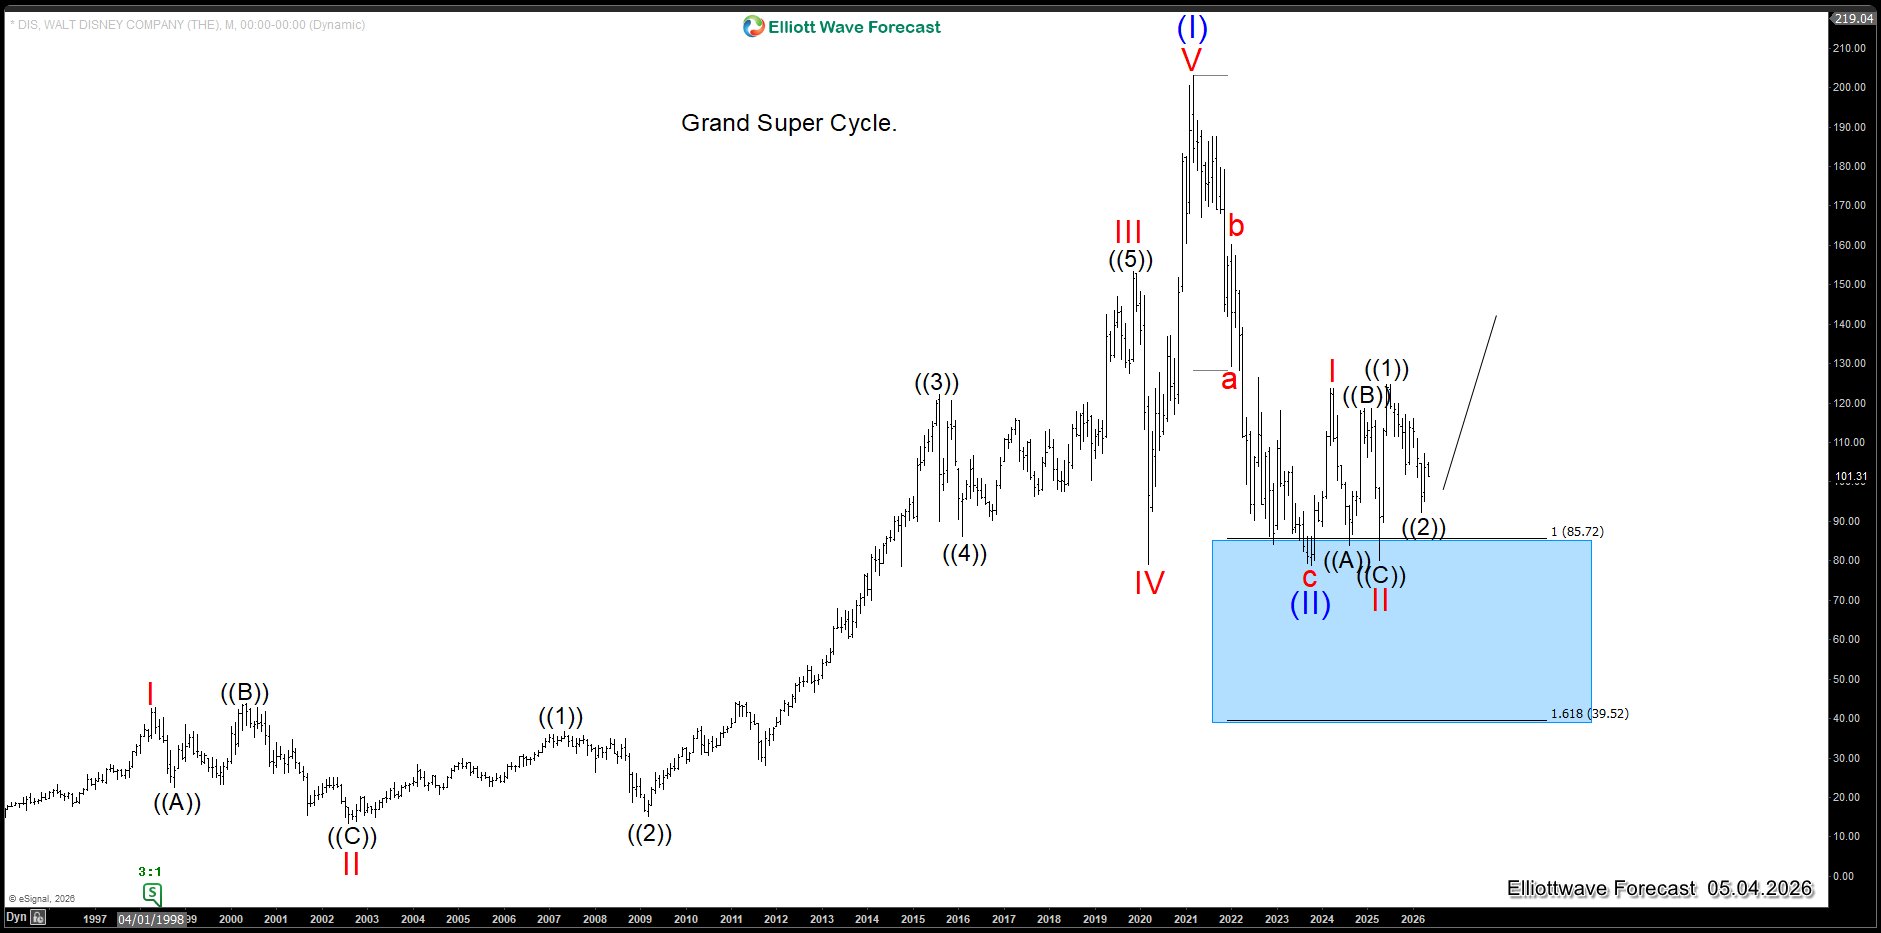
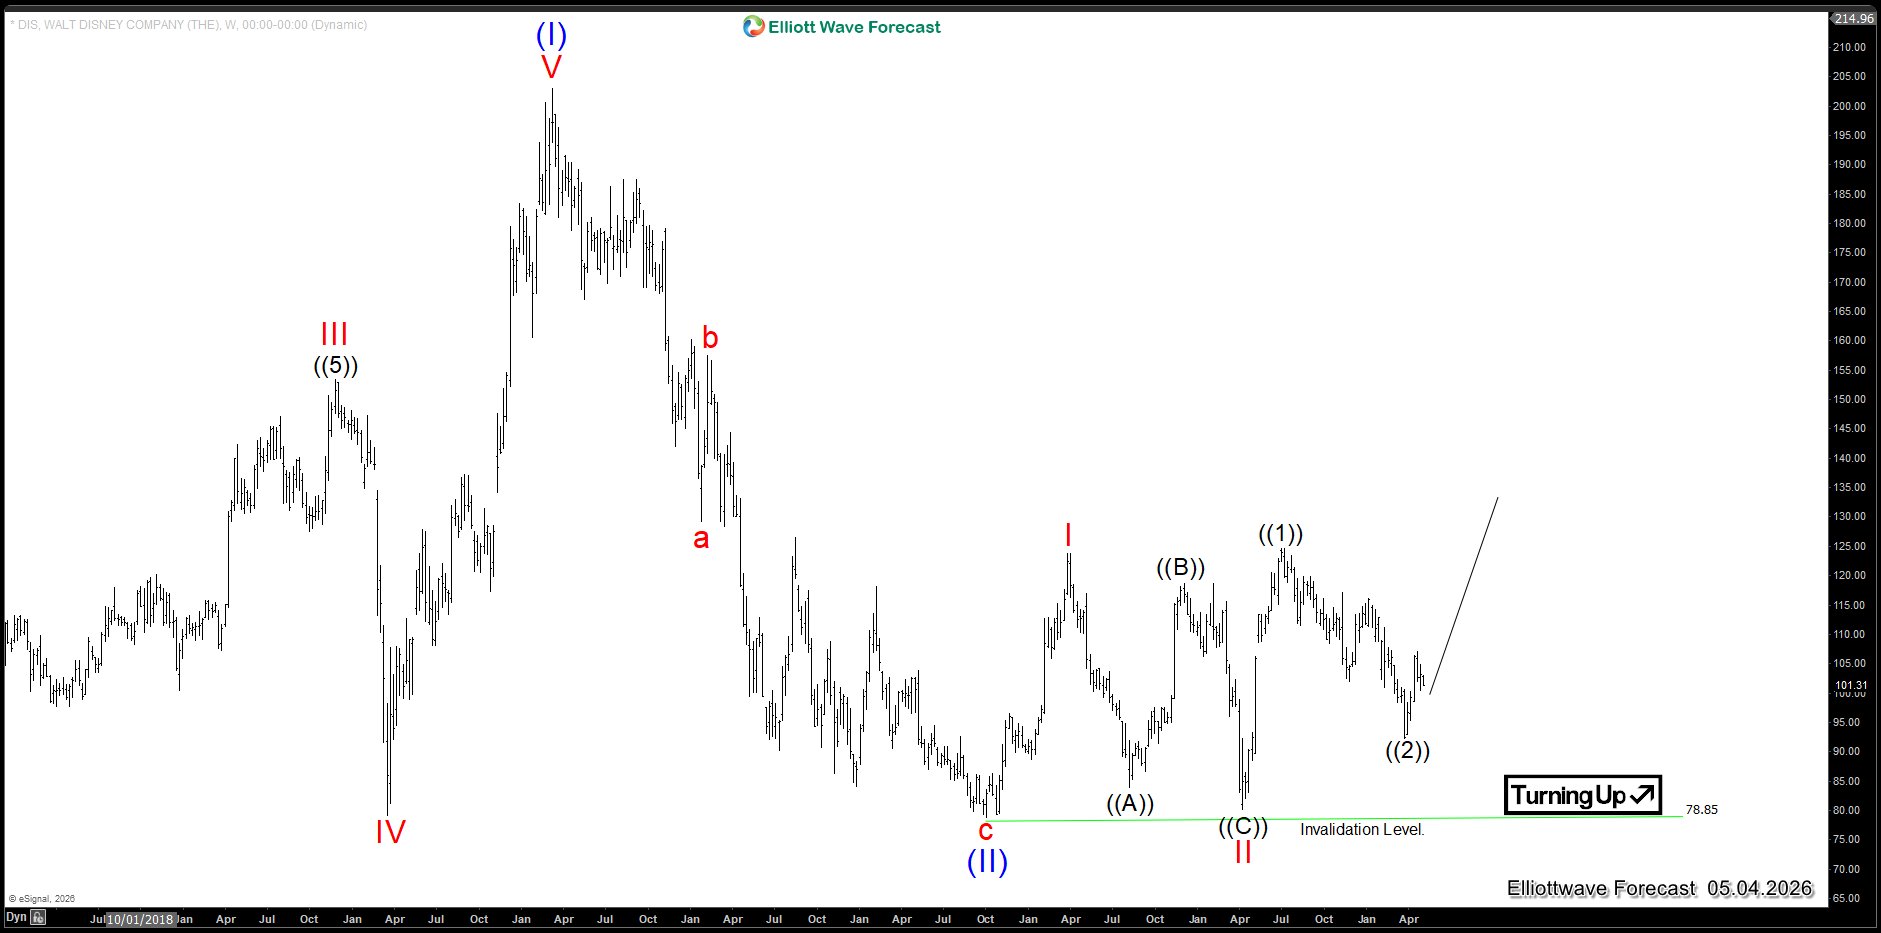
Disney (DIS) : Disney Getting Ready To Rally
The Walt Disney Company (DIS), when viewed through the disciplined framework of Elliott Wave Theory, appears to be approaching a critical inflection point. The charts both the monthly (macro) and weekly (intermediate) timeframes—suggest that Disney is transitioning out of a prolonged corrective phas
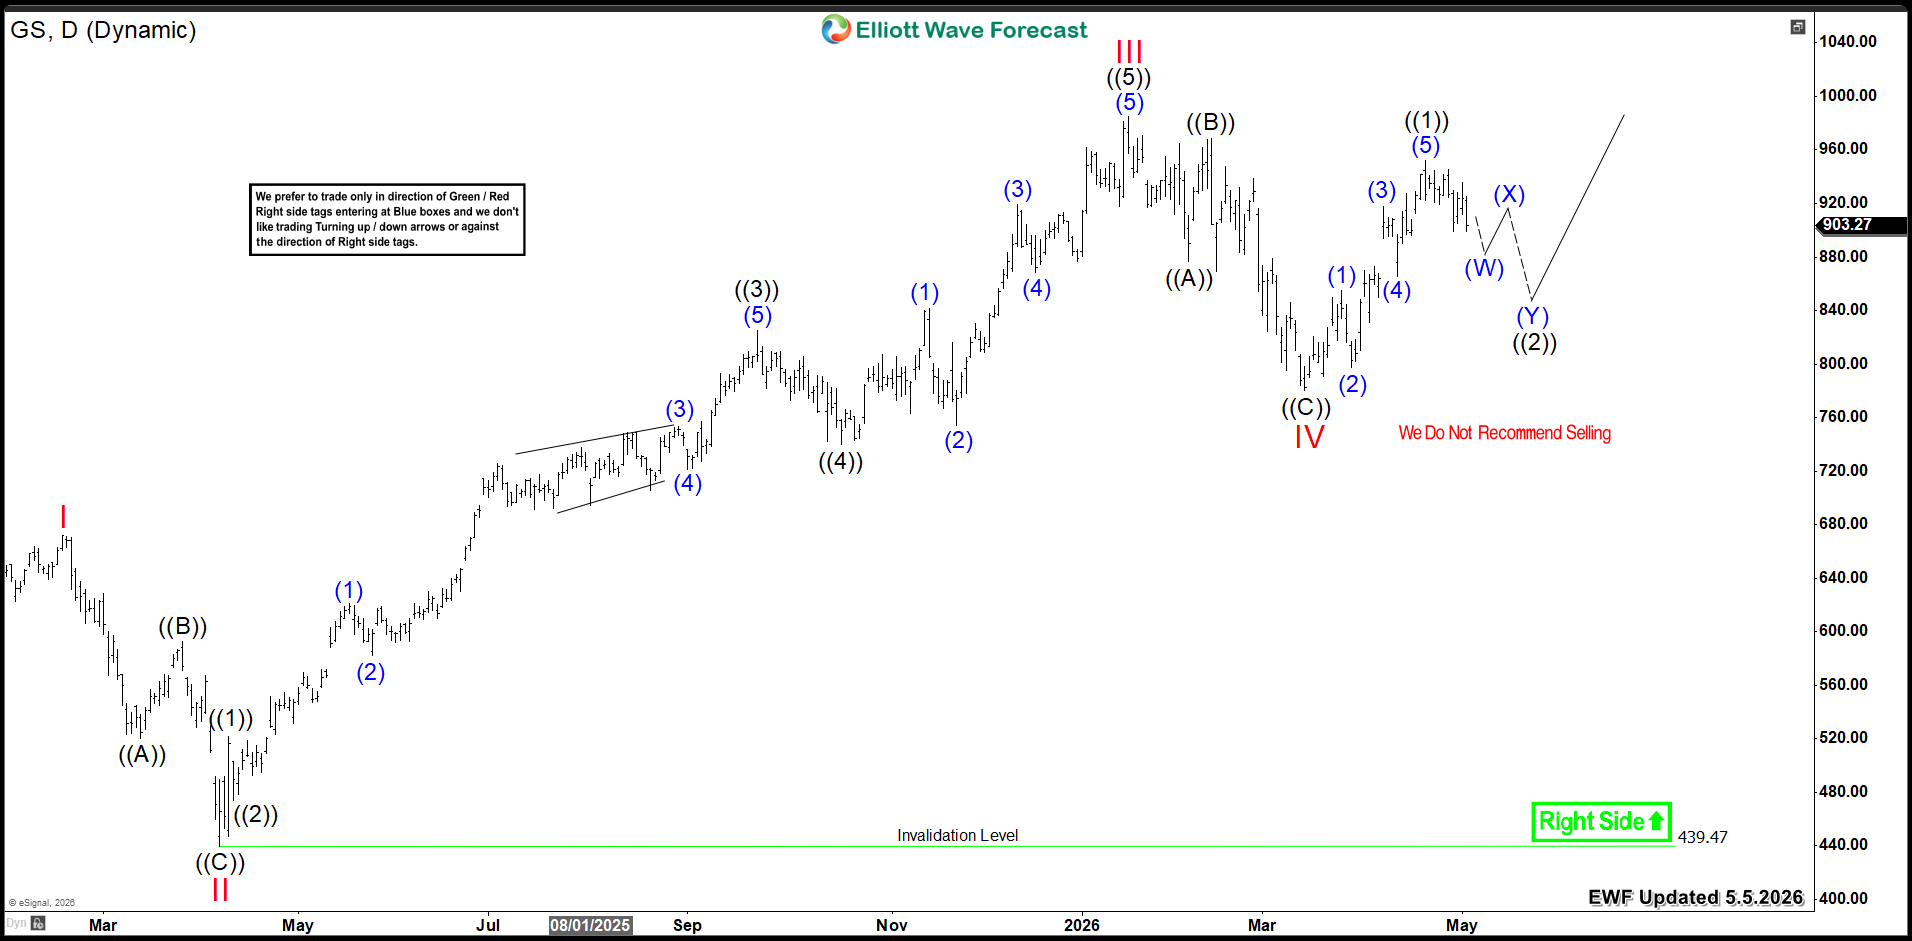
Goldman Sachs (GS) Path to Break $1000 Milestone
Goldman Sachs (NYSE: GS) displays a strong weekly bullish sequence. Today, we explore the Elliott Wave pattern behind this move. Our analysis highlights potential paths and targets for continued momentum. Elliott Wave Analysis Goldman Sachs completed a five-wave advance from its April 2025 low.
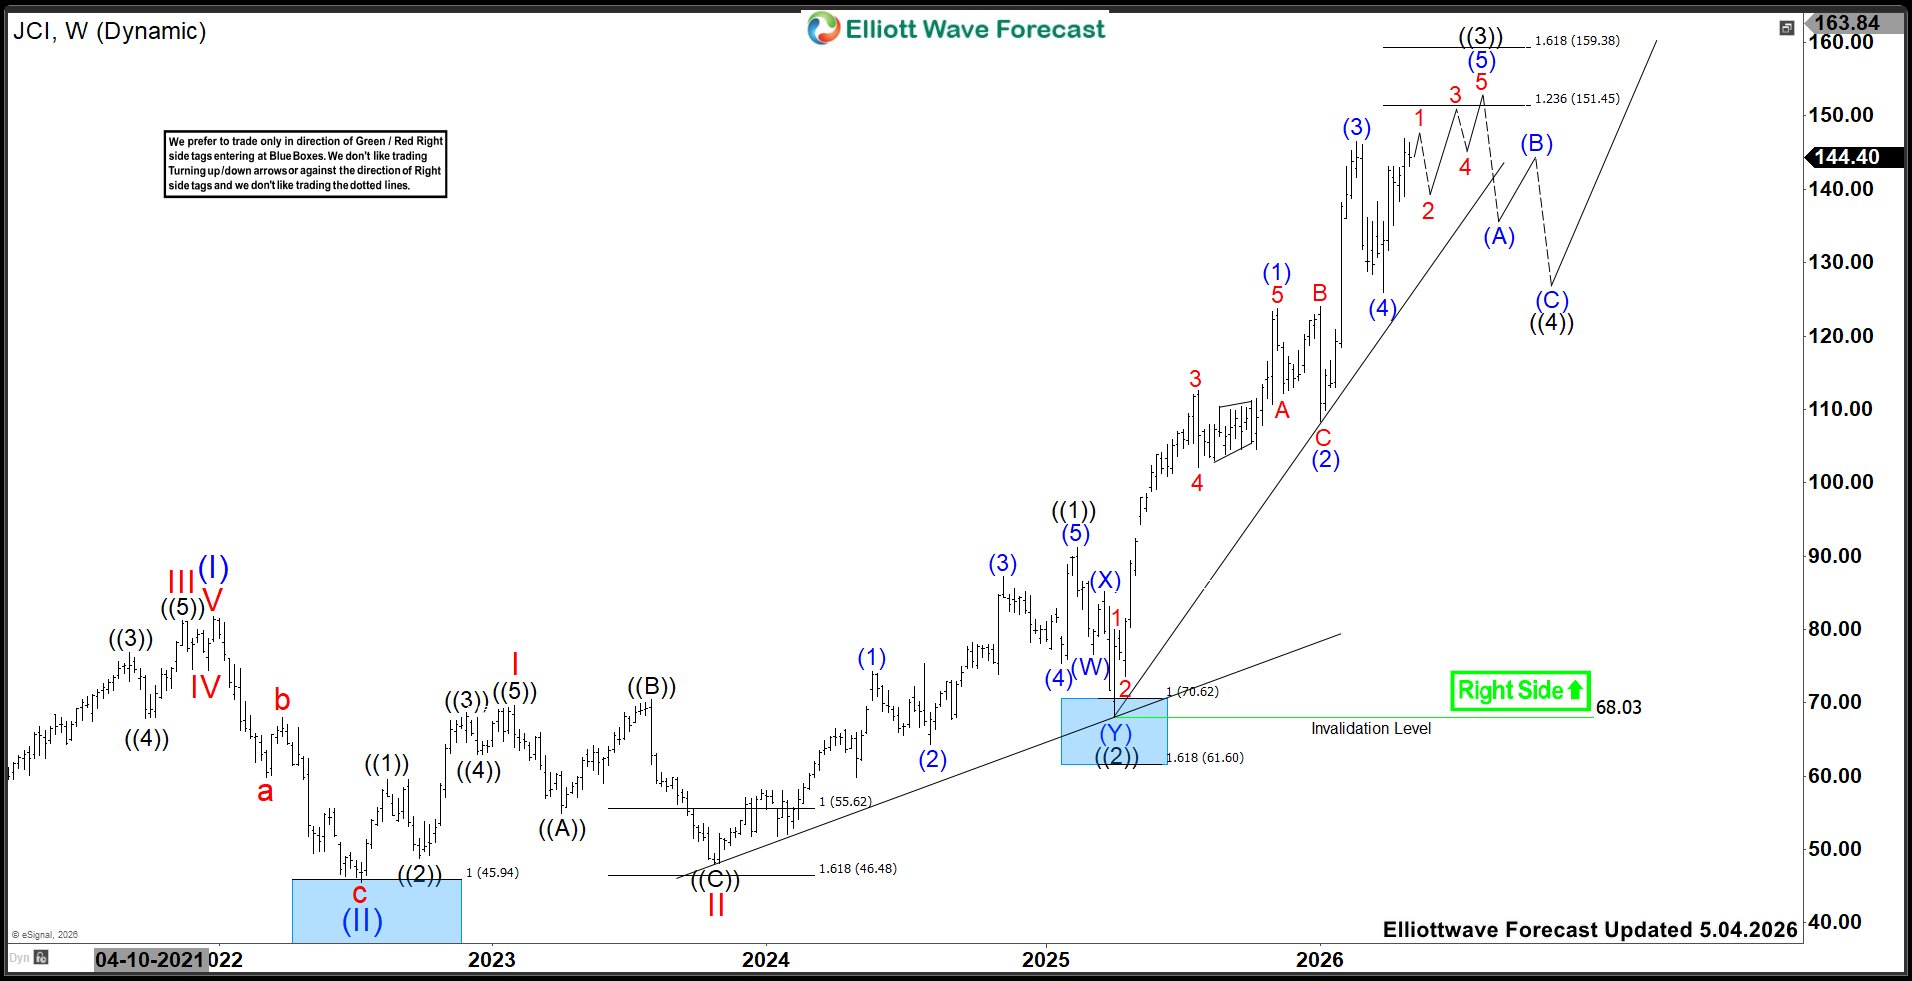
Johnson Controls (JCI) Forecast: Rally Targeting 151.45 - 159.38 Before Pullback
Johnson Controls International plc, (JCI) engages in engineering, manufacturing, commissioning & retrofitting building products & systems in United States & globally. It operates in four segments like Building Solutions in North America, Building Solutions EMEA/LA, Building Solutions Asi
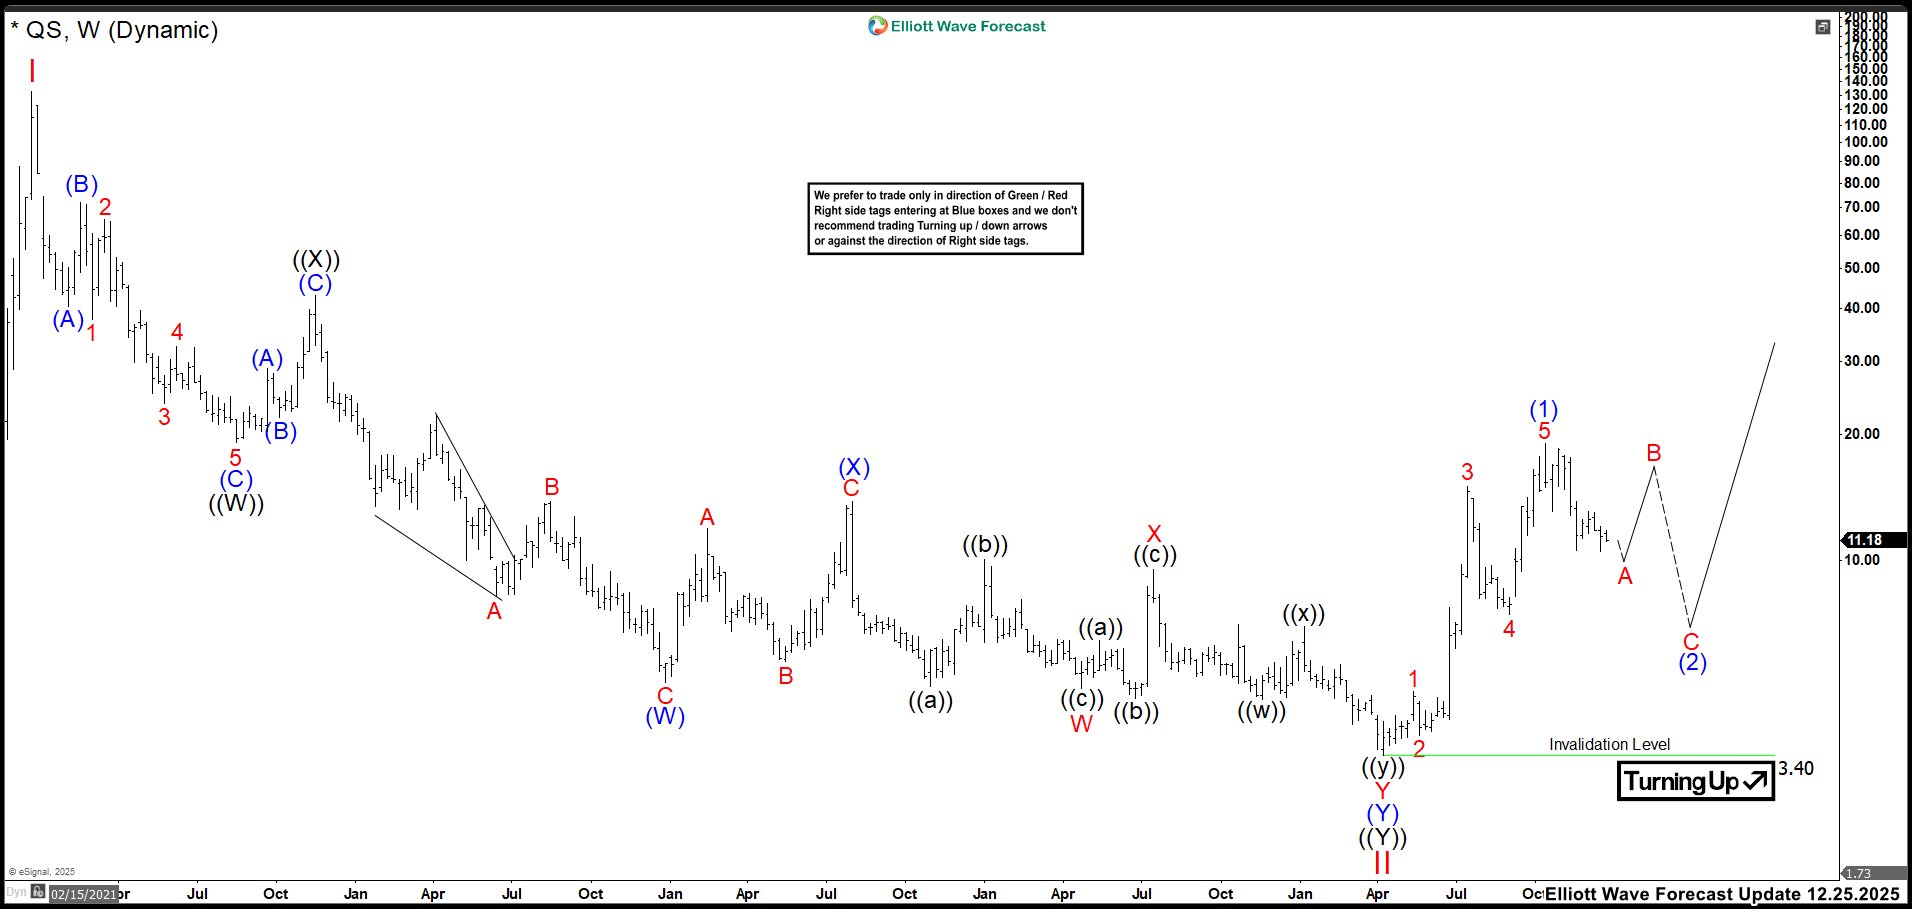
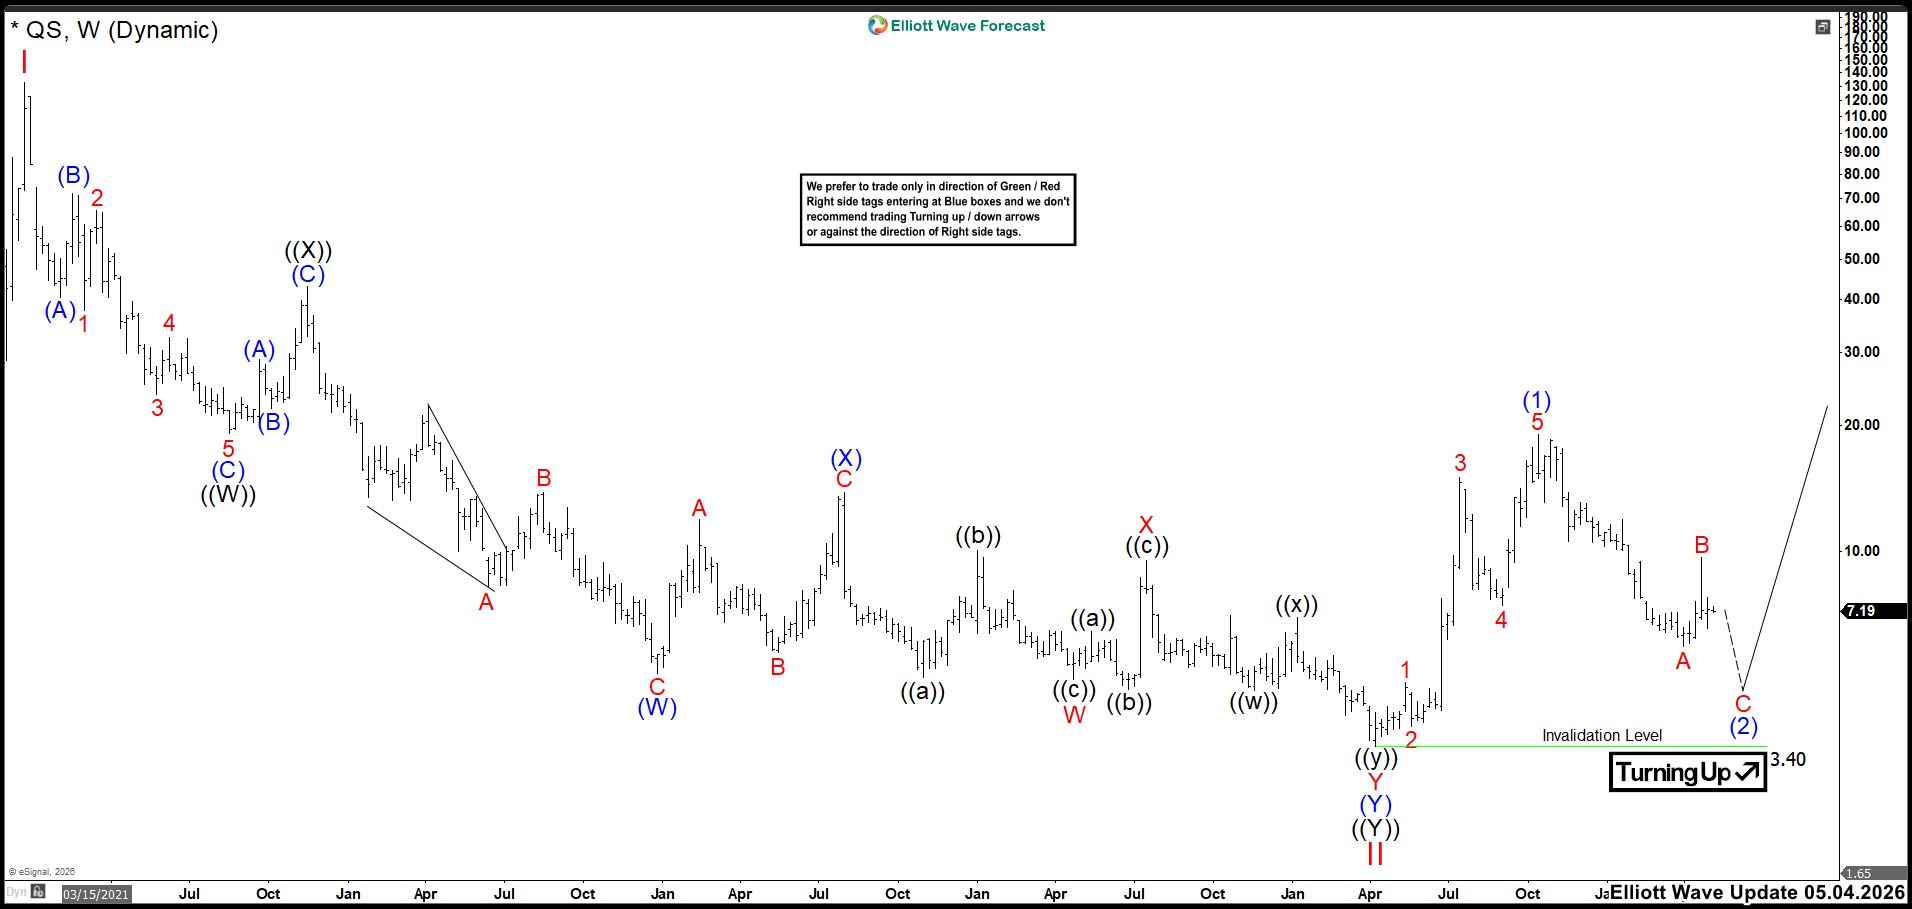
QuantumScape (QS) Targets 5 – 3.60 Zone
QuantumScape (QS) trades lower as investors wait for clearer revenue progress. Analysts expect another loss this quarter, with EPS near –0.18, matching recent trends. However, the company continues improving efficiency, and recent results beat expectations. Therefore, experts see gradual progress bu
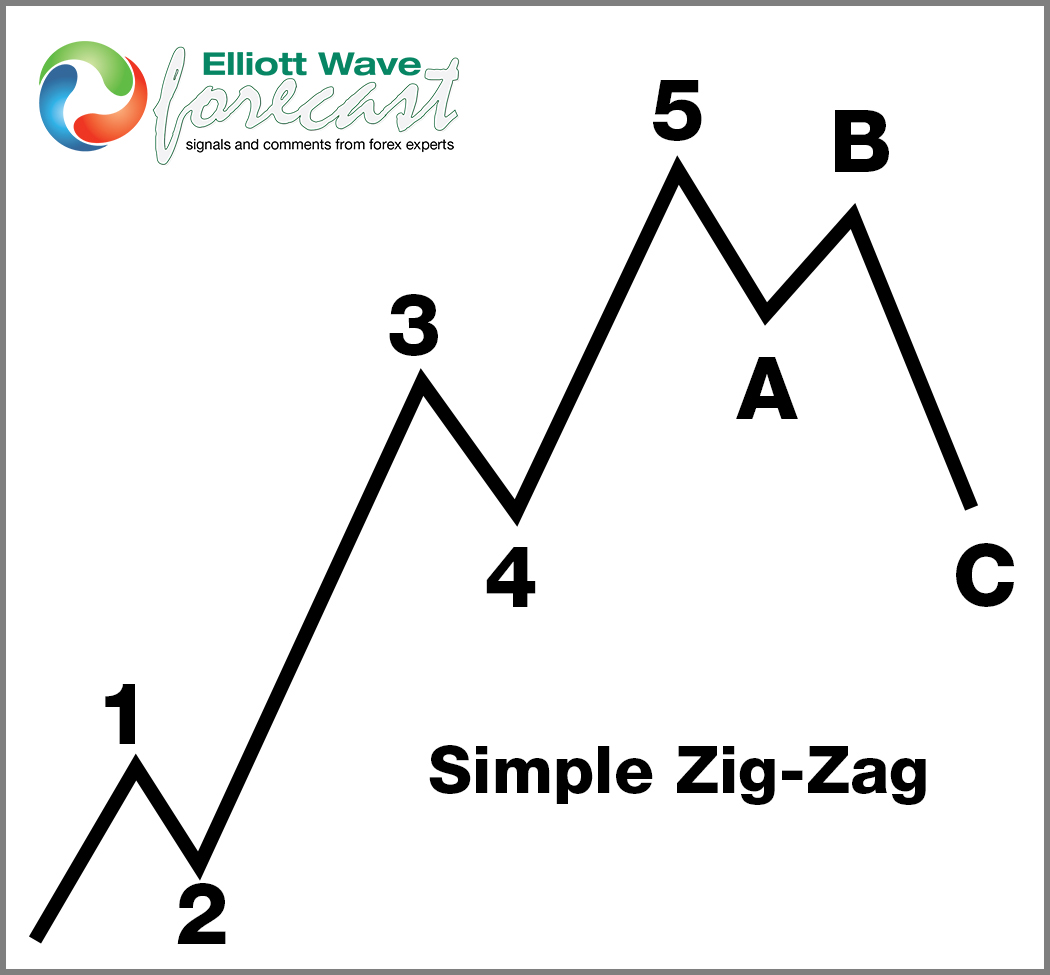
$AMD Elliott Wave Forecast: Reaction Higher From Blue Box Support
In this Elliott Wave update, we look at the latest price action in Advanced Micro Devices Inc. ($AMD). The stock extended lower into the short-term blue box area at 312.17–296.13 and ended the cycle from the 4/27 peak. As expected, buyers appeared in that zone and triggered a reaction higher. Theref
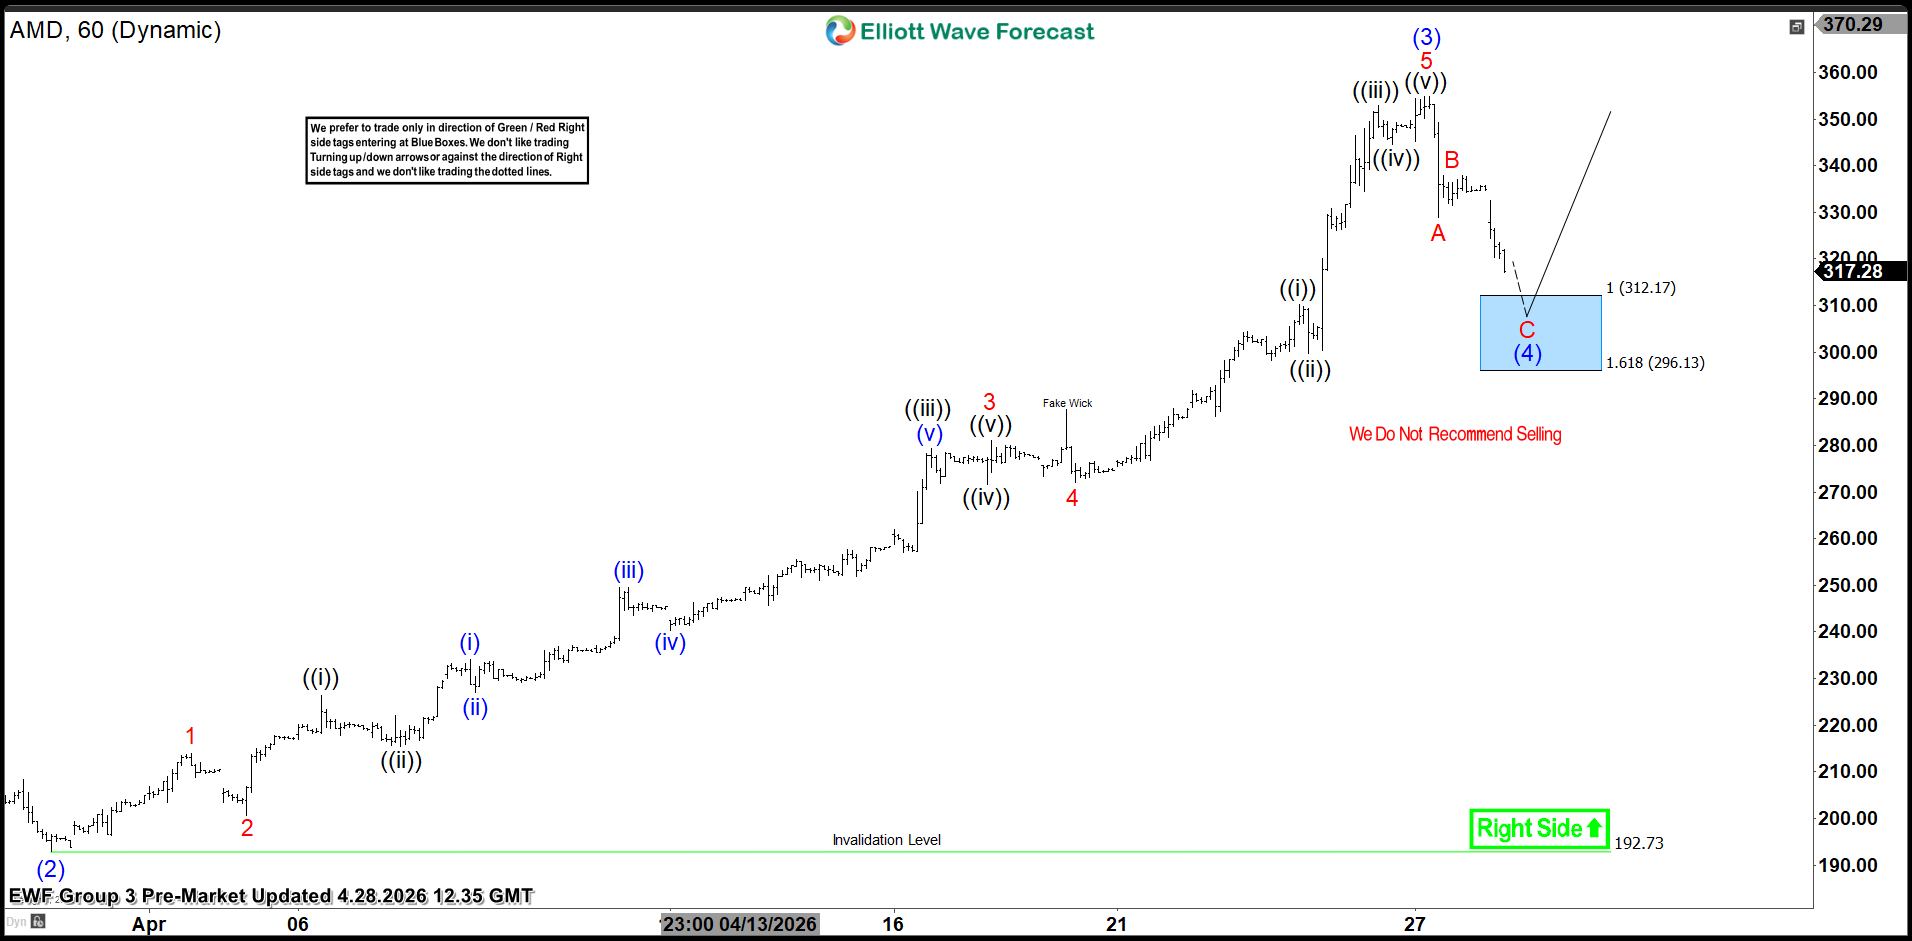
BRK.B (Berkshire Hathaway) Pullback to Offer Buying Opportunity
Berkshire Hathaway (BRK.B) continues to trade within a strong bullish Elliott Wave structure, supported by a clear sequence of higher highs and higher lows. The long-term trend remains firmly to the upside, and the stock has developed a well-defined impulsive cycle over recent years. From the chart,
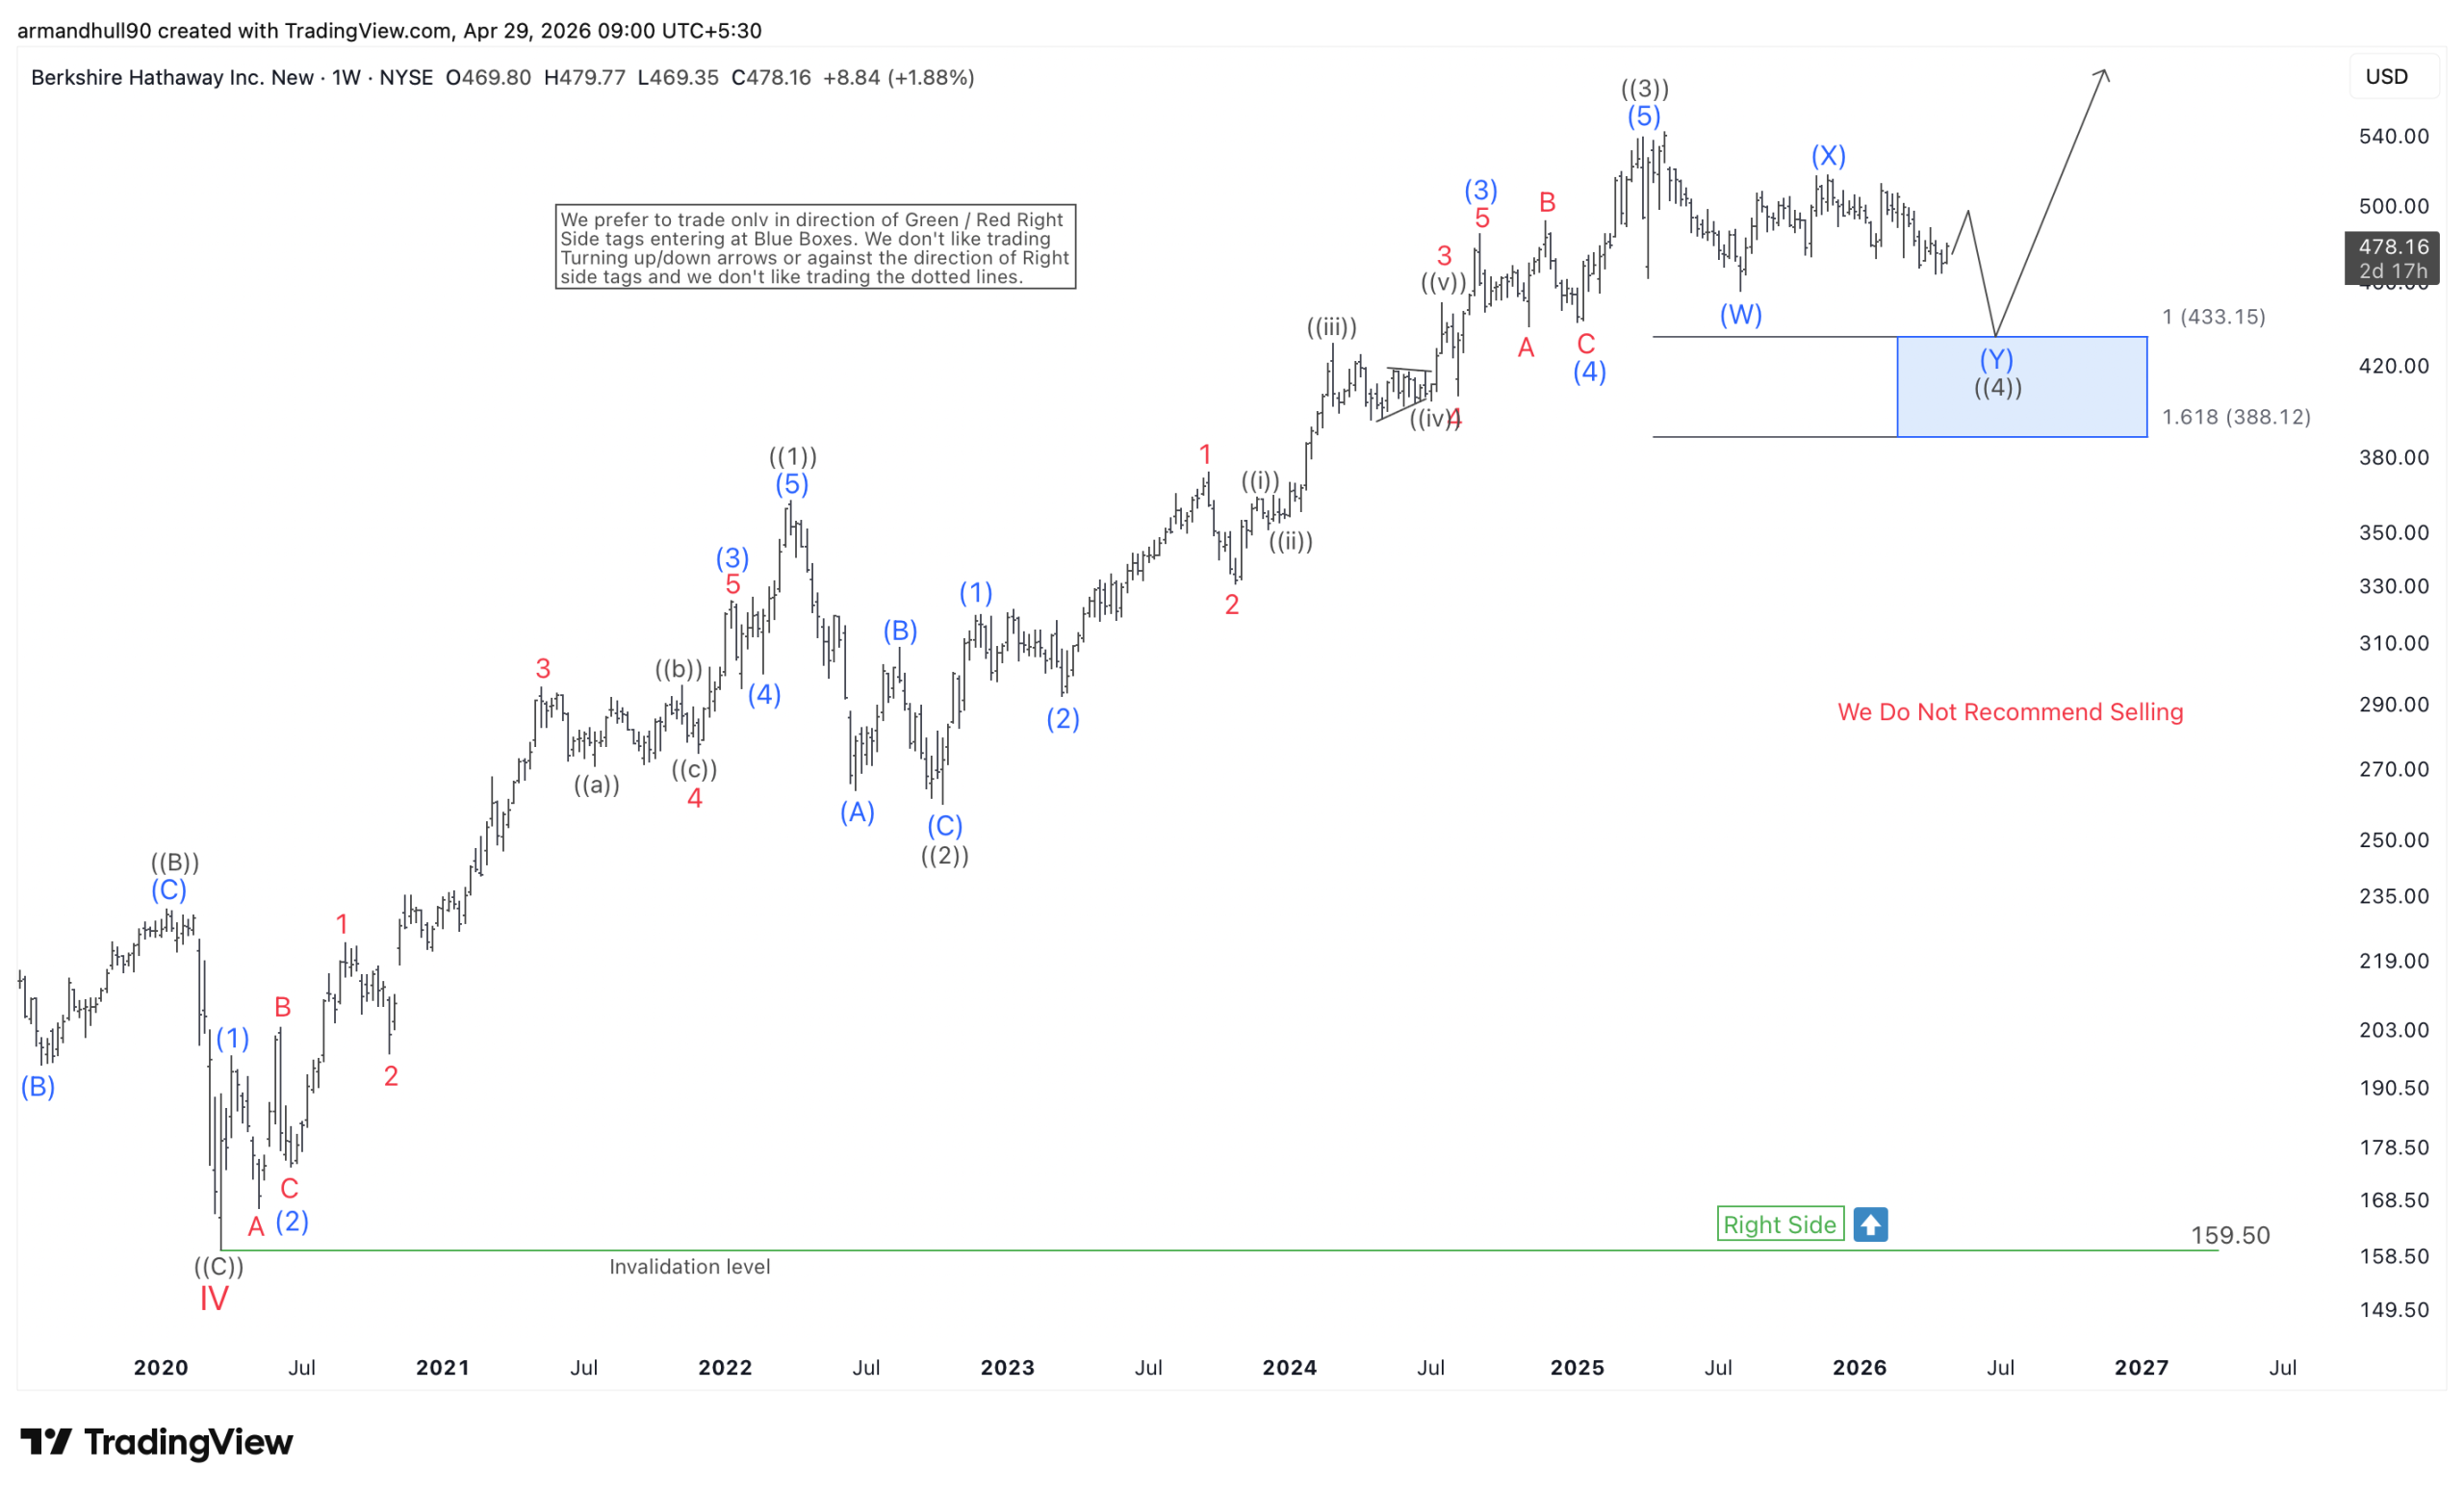
VTR Elliott Wave Analysis: Bullish Trend Targets 104 and Beyond
Ventas (VTR) continues to display a strong bullish structure based on Elliott Wave analysis. The stock has developed a clear impulsive sequence from its major low, forming higher highs and higher lows across multiple time frames. This price action reflects steady demand and supports a continuation o
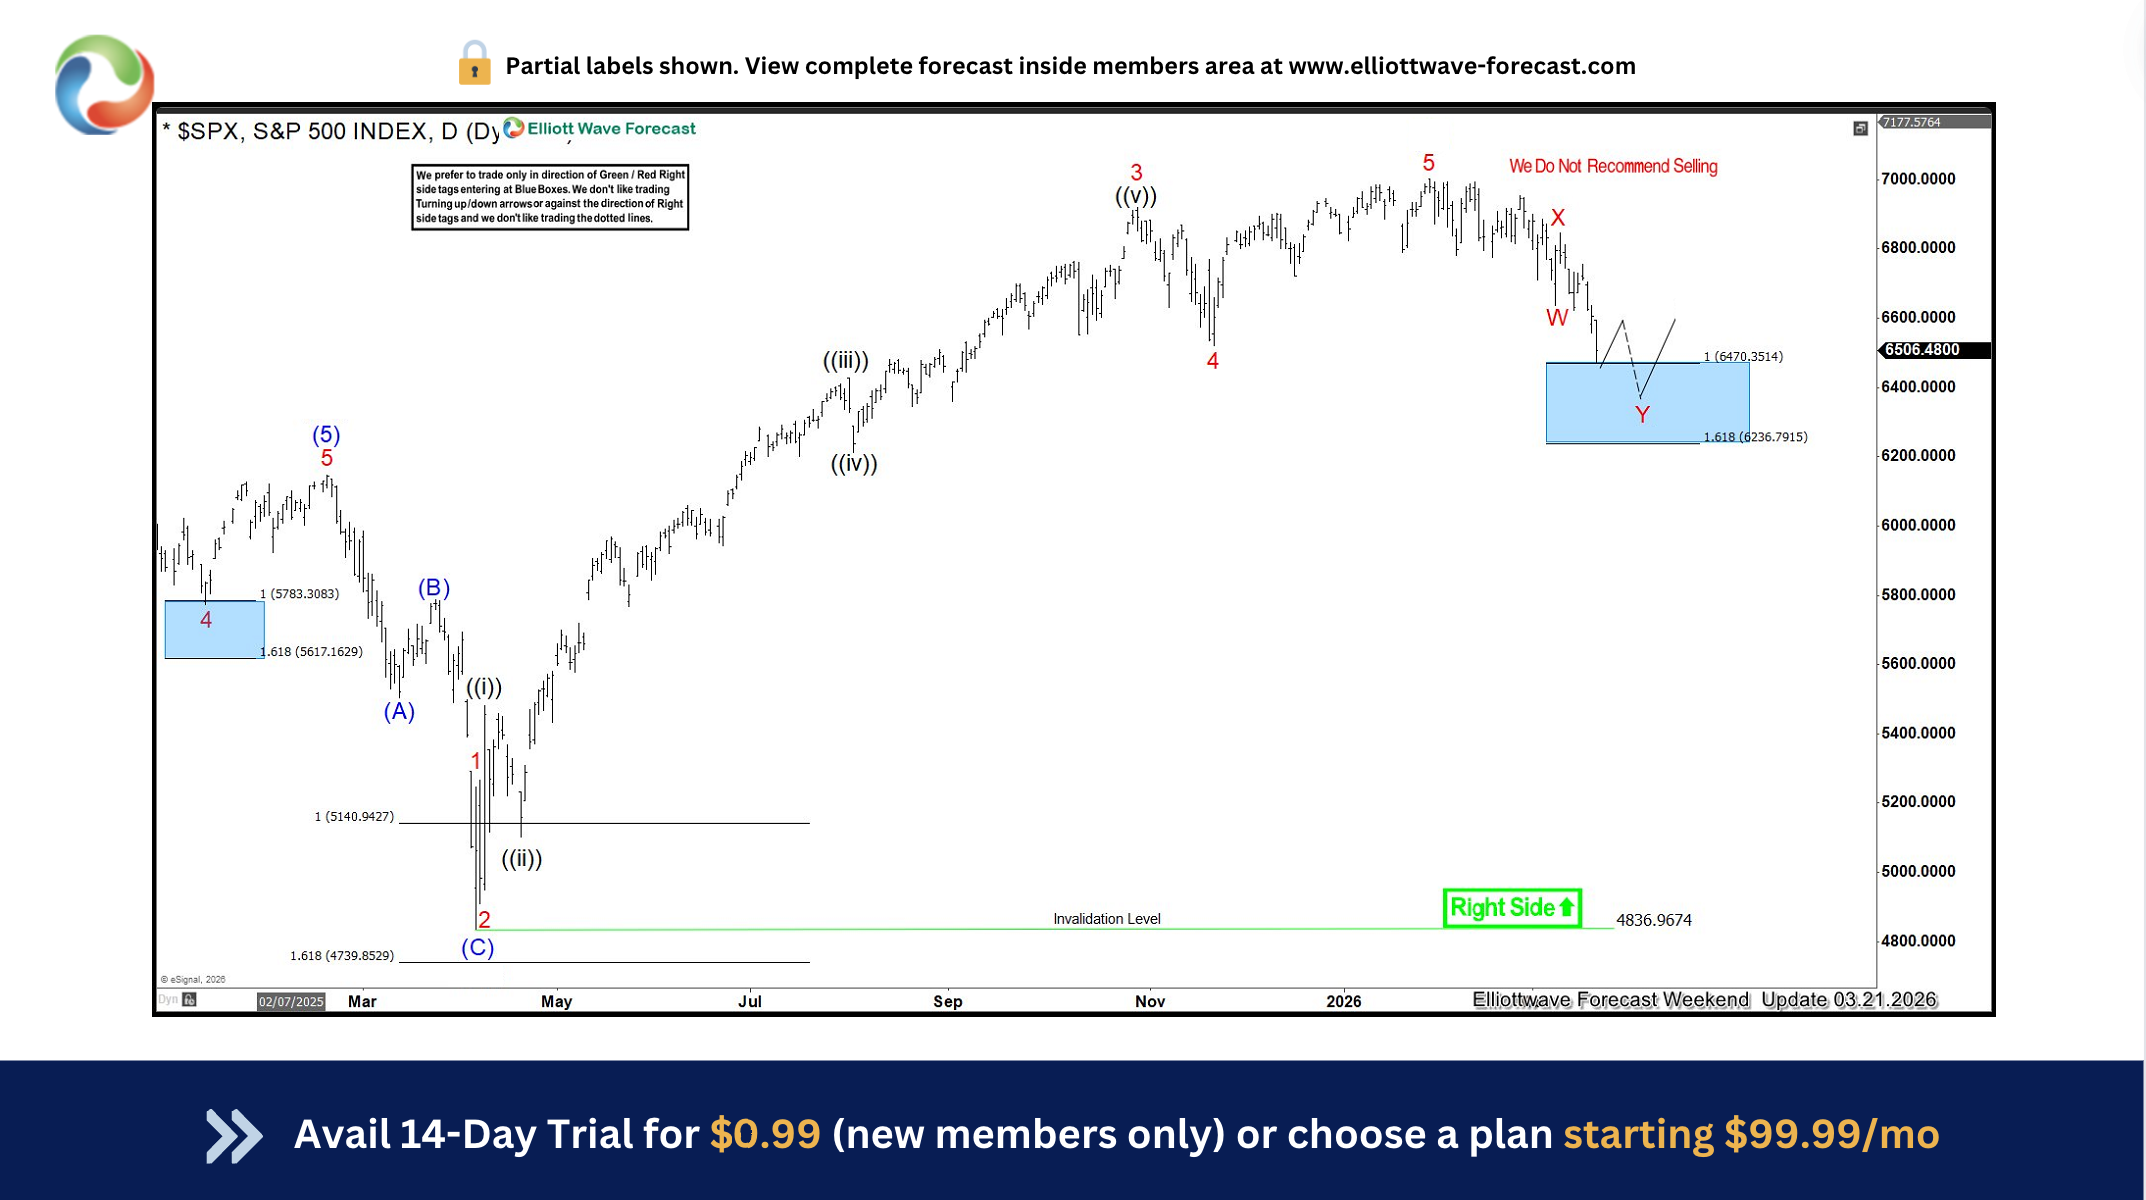
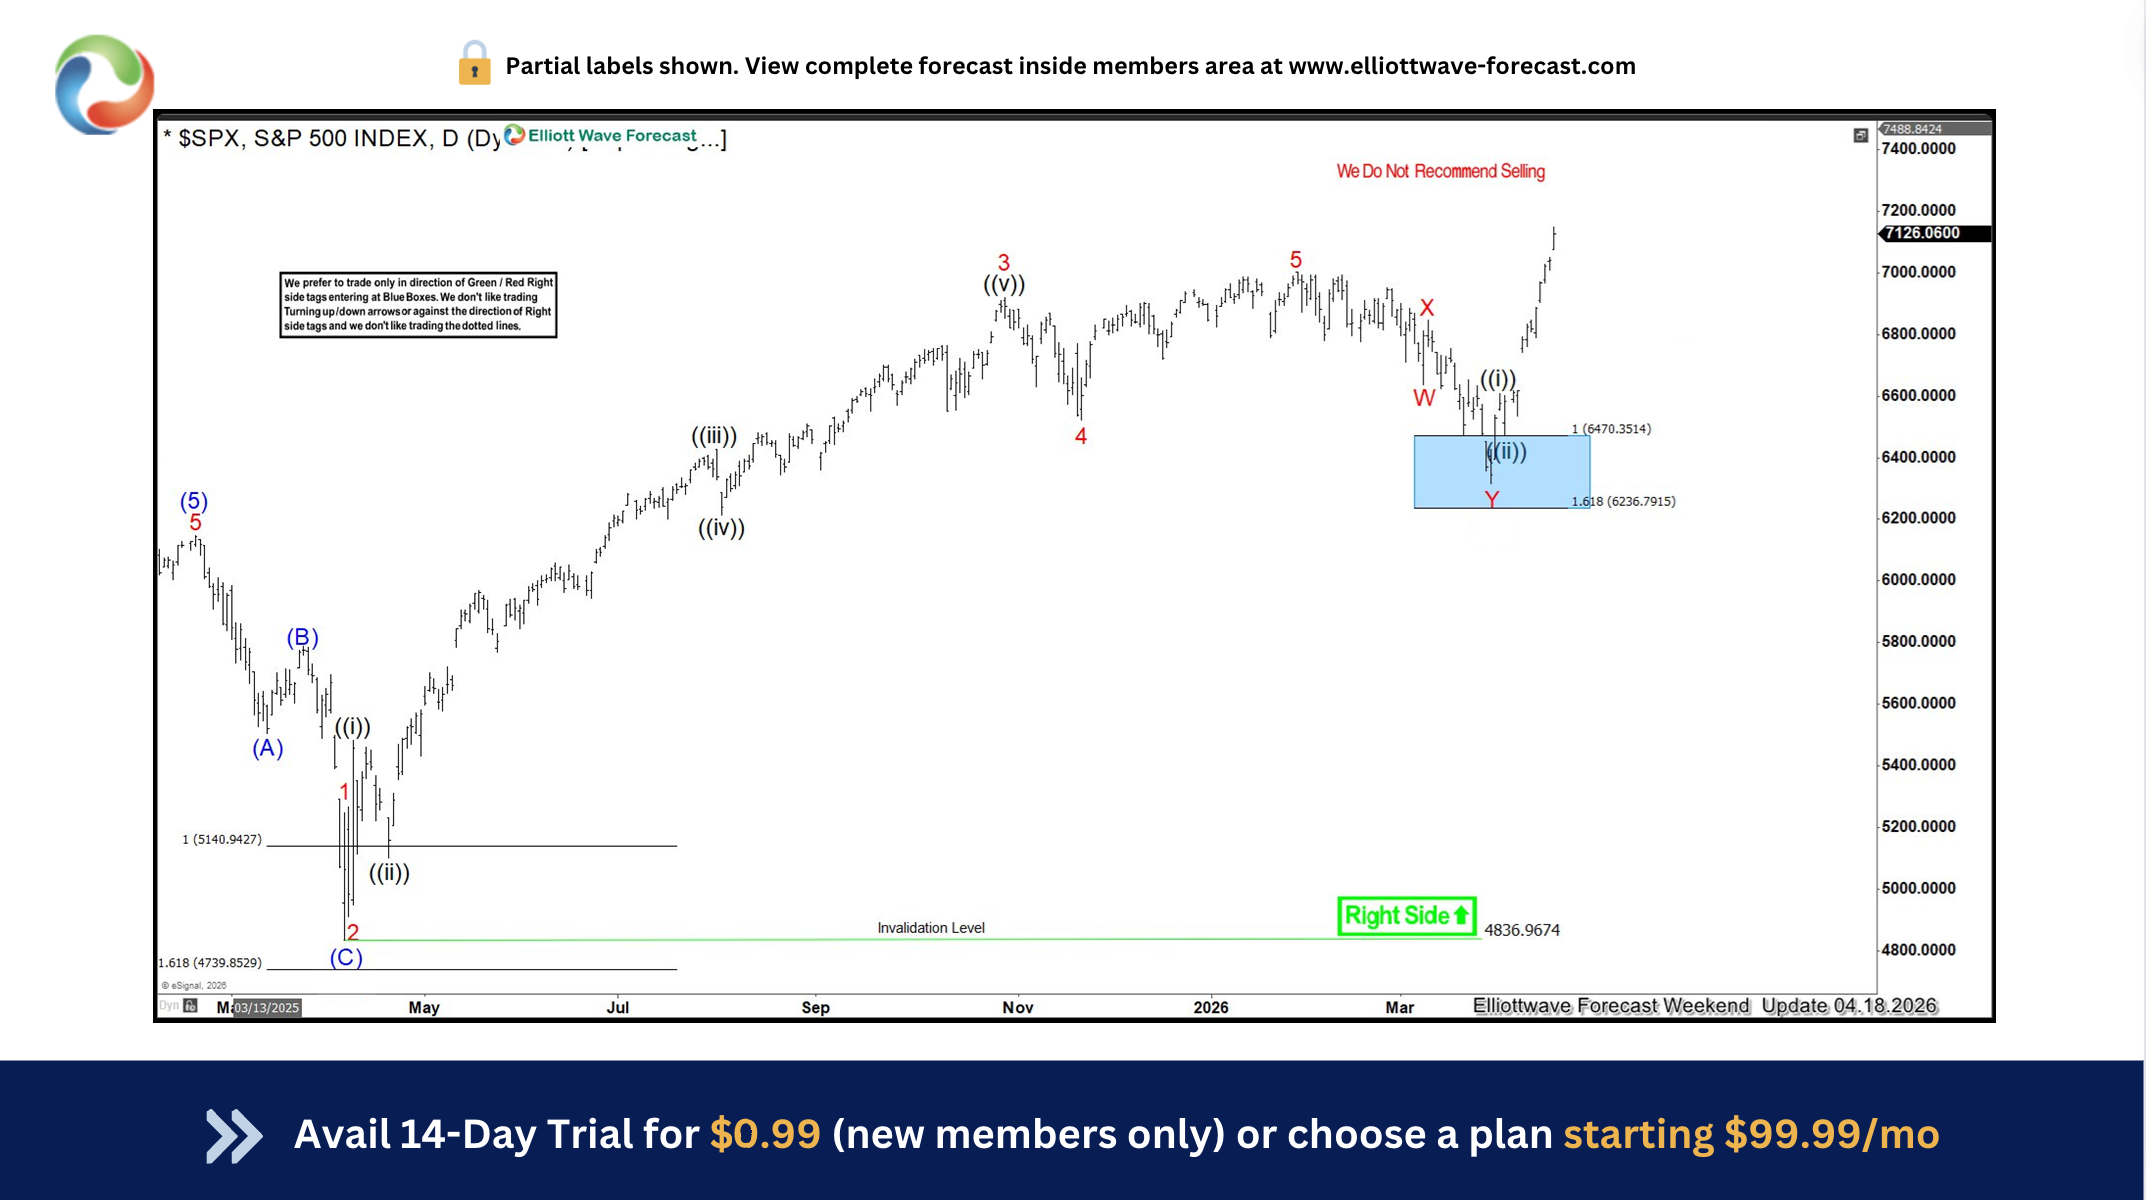
Market Respects the Blue Box in SPX(S&P500), Delivering the Anticipated Move Amid War
In trading, there are moments that validate not just a strategy—but an entire framework of understanding market behavior. The recent movement in the S&P 500 is one of those moments. Weeks ago, we outlined a projection that the market would decline into a predefined Blue Box area 6470.3514 – 6236
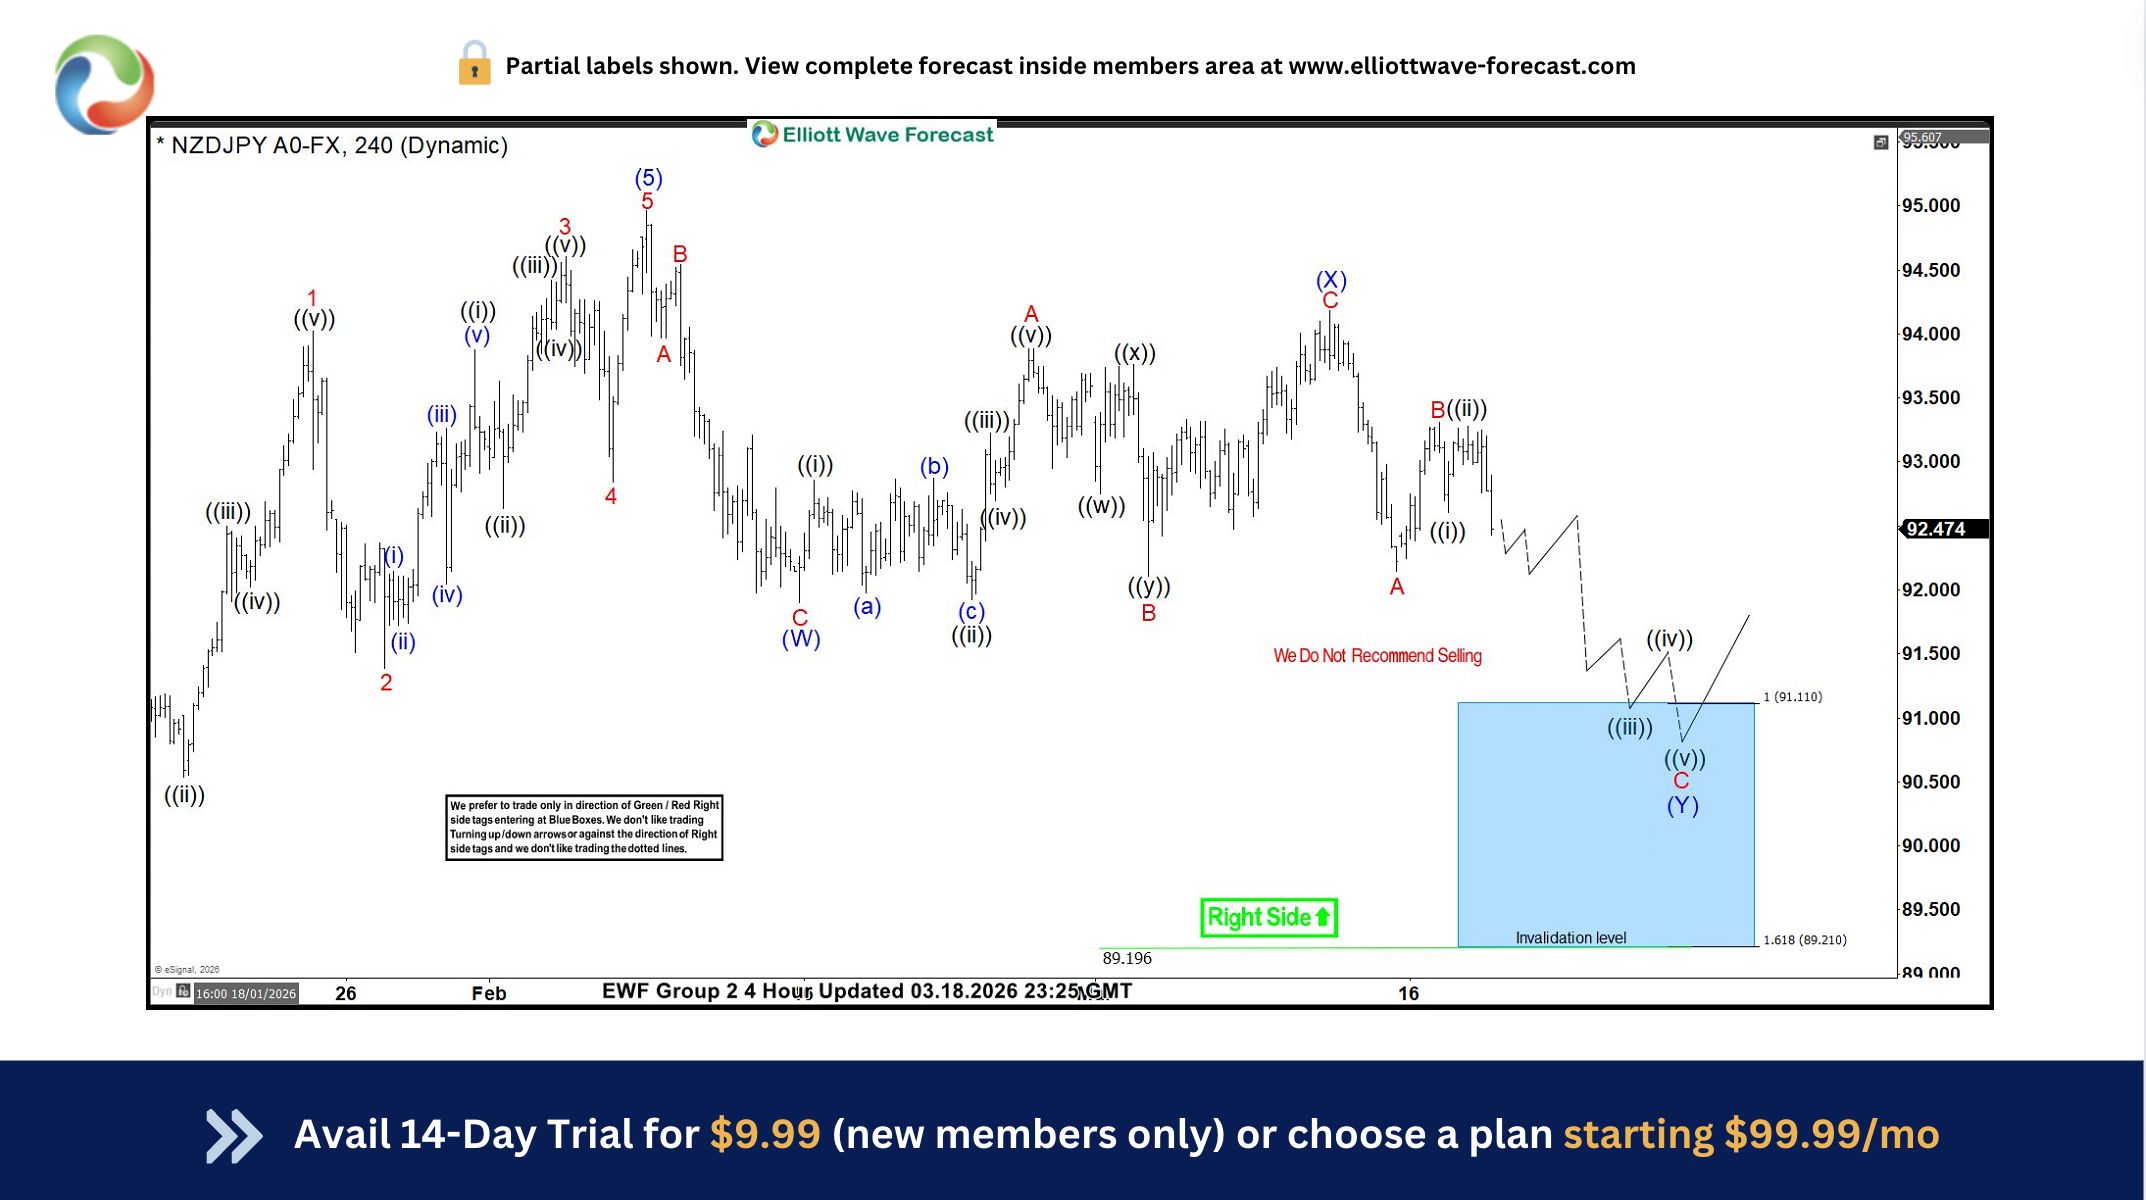
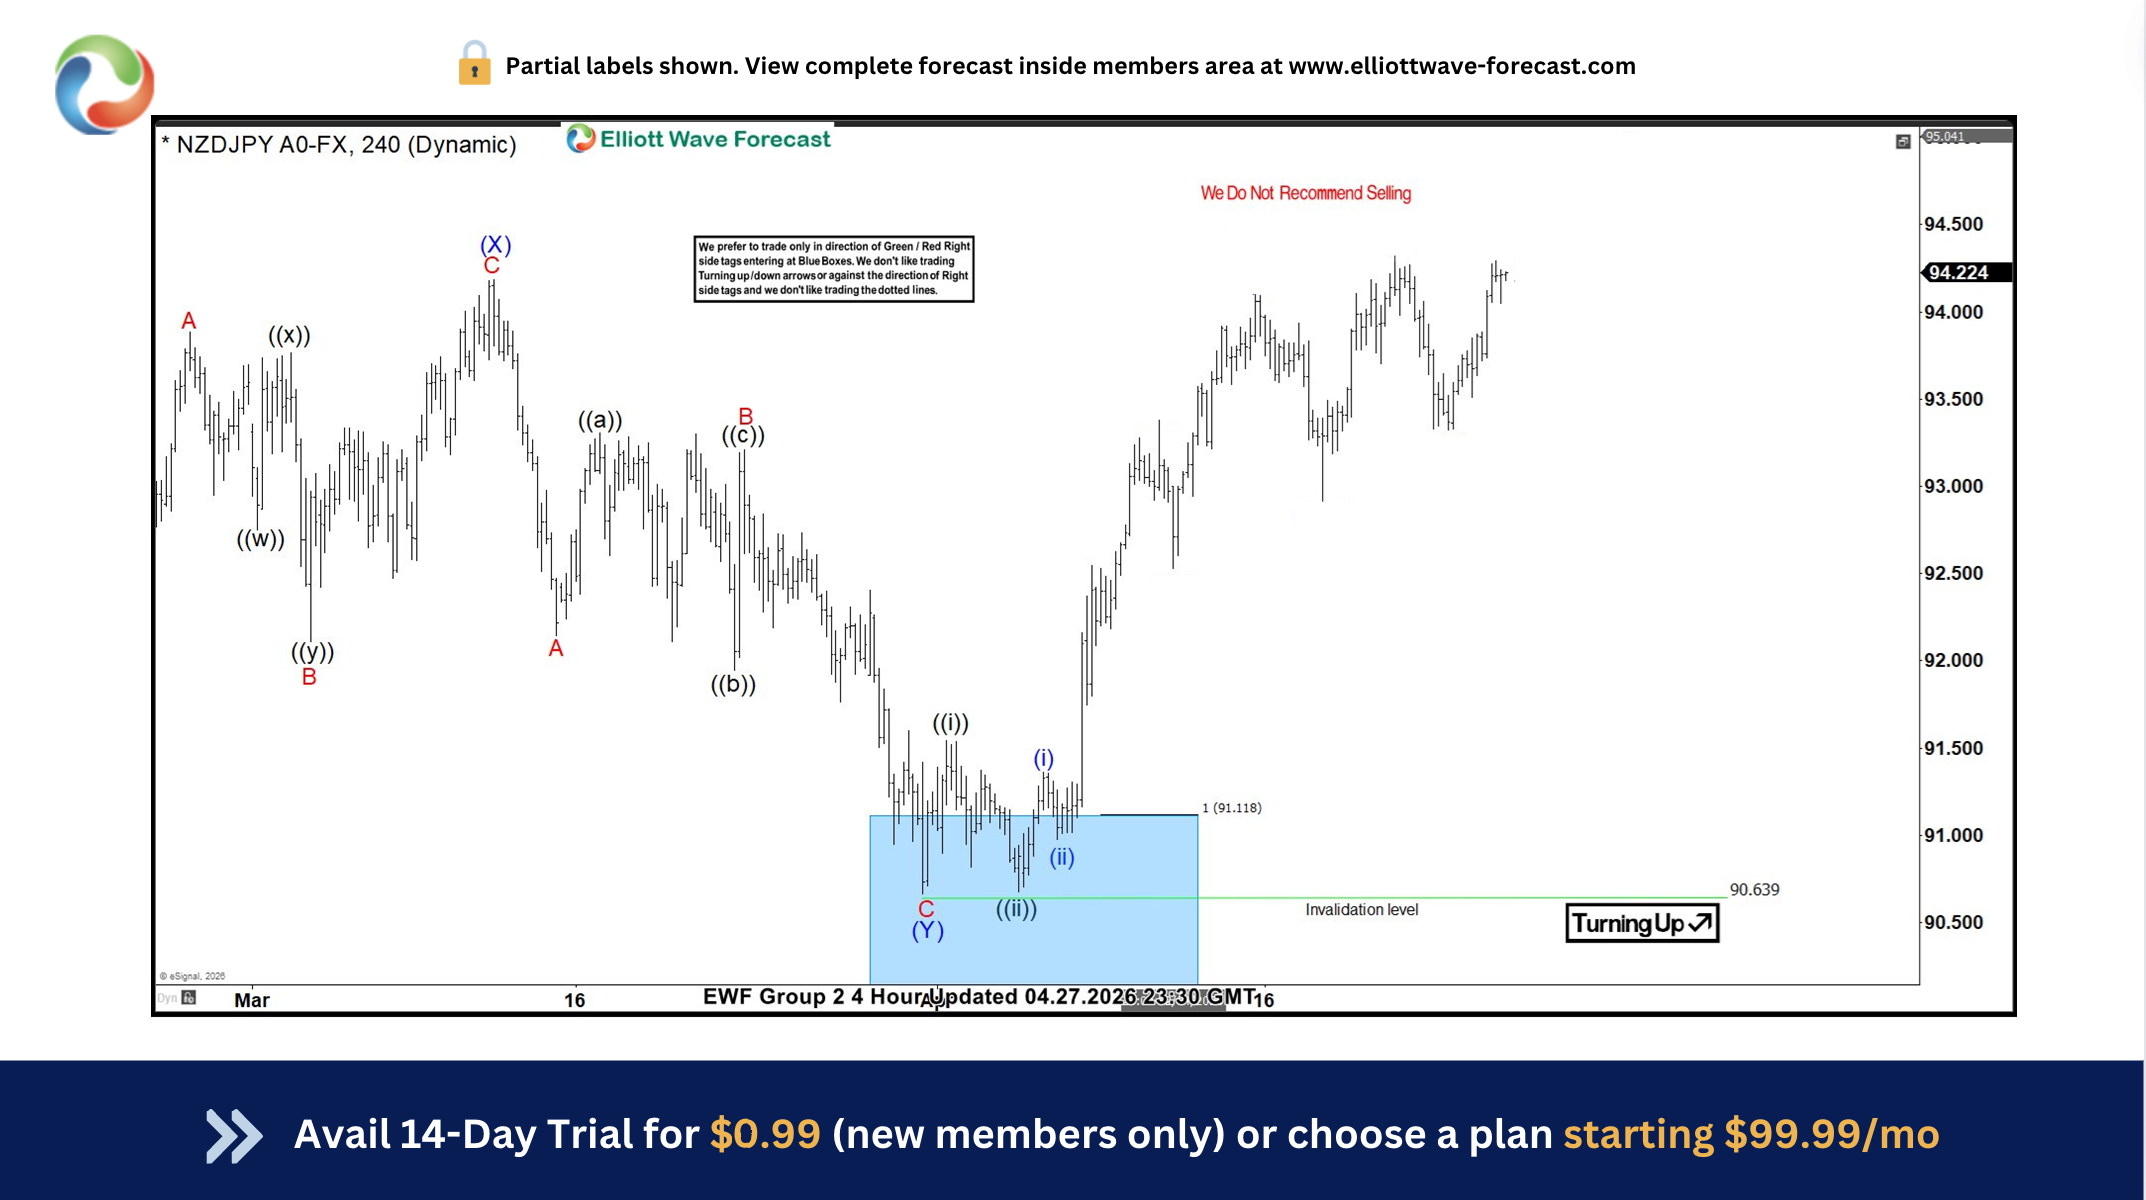
Elliott Wave in Action: NZDJPY Pushes Higher from Blue Box Area
In this technical blog, we will look at the past performance of the 4-hour Elliott Wave Charts of NZDJPY. In which, the rally from 09 April 2025 low is unfolding as an impulse sequence. Therefore, called for more upside to take place. We knew that the structure in the pair should remains incomplete
Citigroup (NYSE: C) Bullish Path Above $150
Citigroup (NYSE: C) resumed its bullish trend despite an early correction this year. The stock broke again to new all-time highs. Today, we dive into its daily technical chart. Our analysis explores the Elliott Wave structure currently supporting the rally. Looking at Citigroup's daily chart, the cy
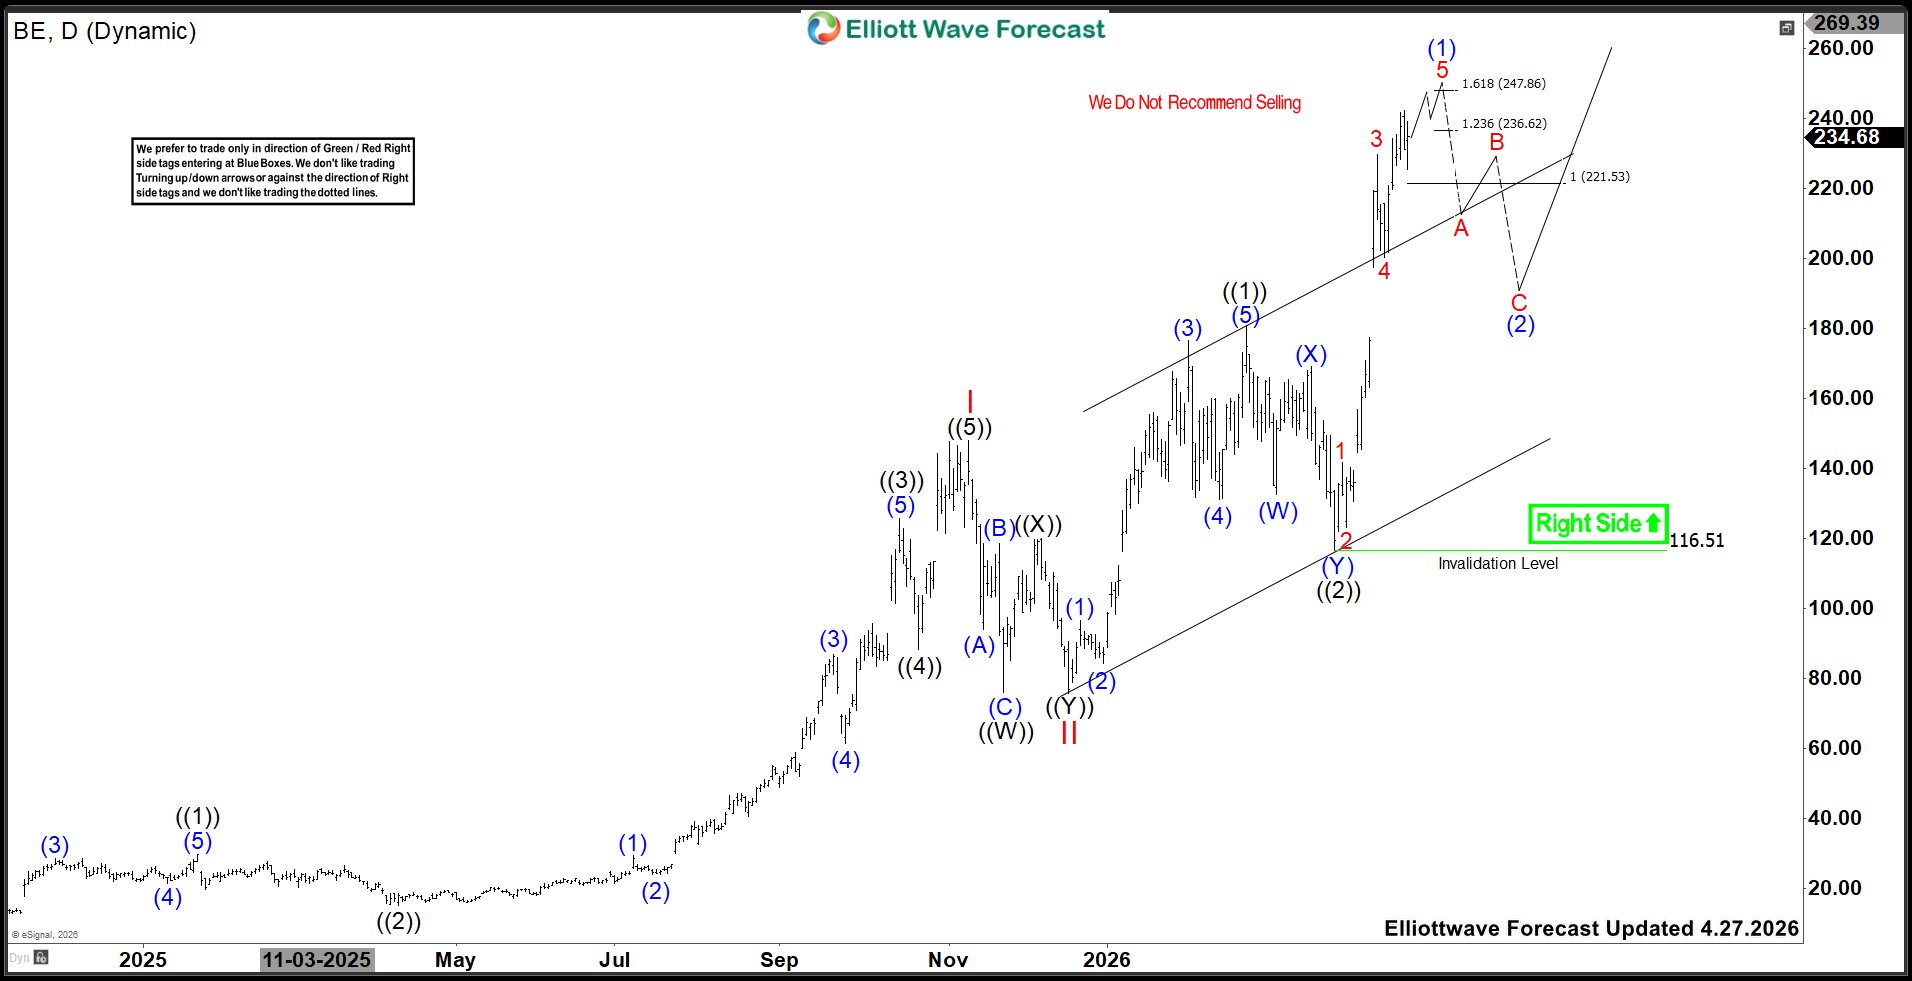
Bloom Energy (BE): Favors Rally in to $247.8–$286.5 Zone Before Pullback
Bloom Energy Corporation., (BE) designs, manufactures, sells & install solid-oxide fuel cell systems for on-site power generation in the United States & globally. It offers Bloom Energy Server, a power generation platform to convert different fuels through electrochemical process. It comes u
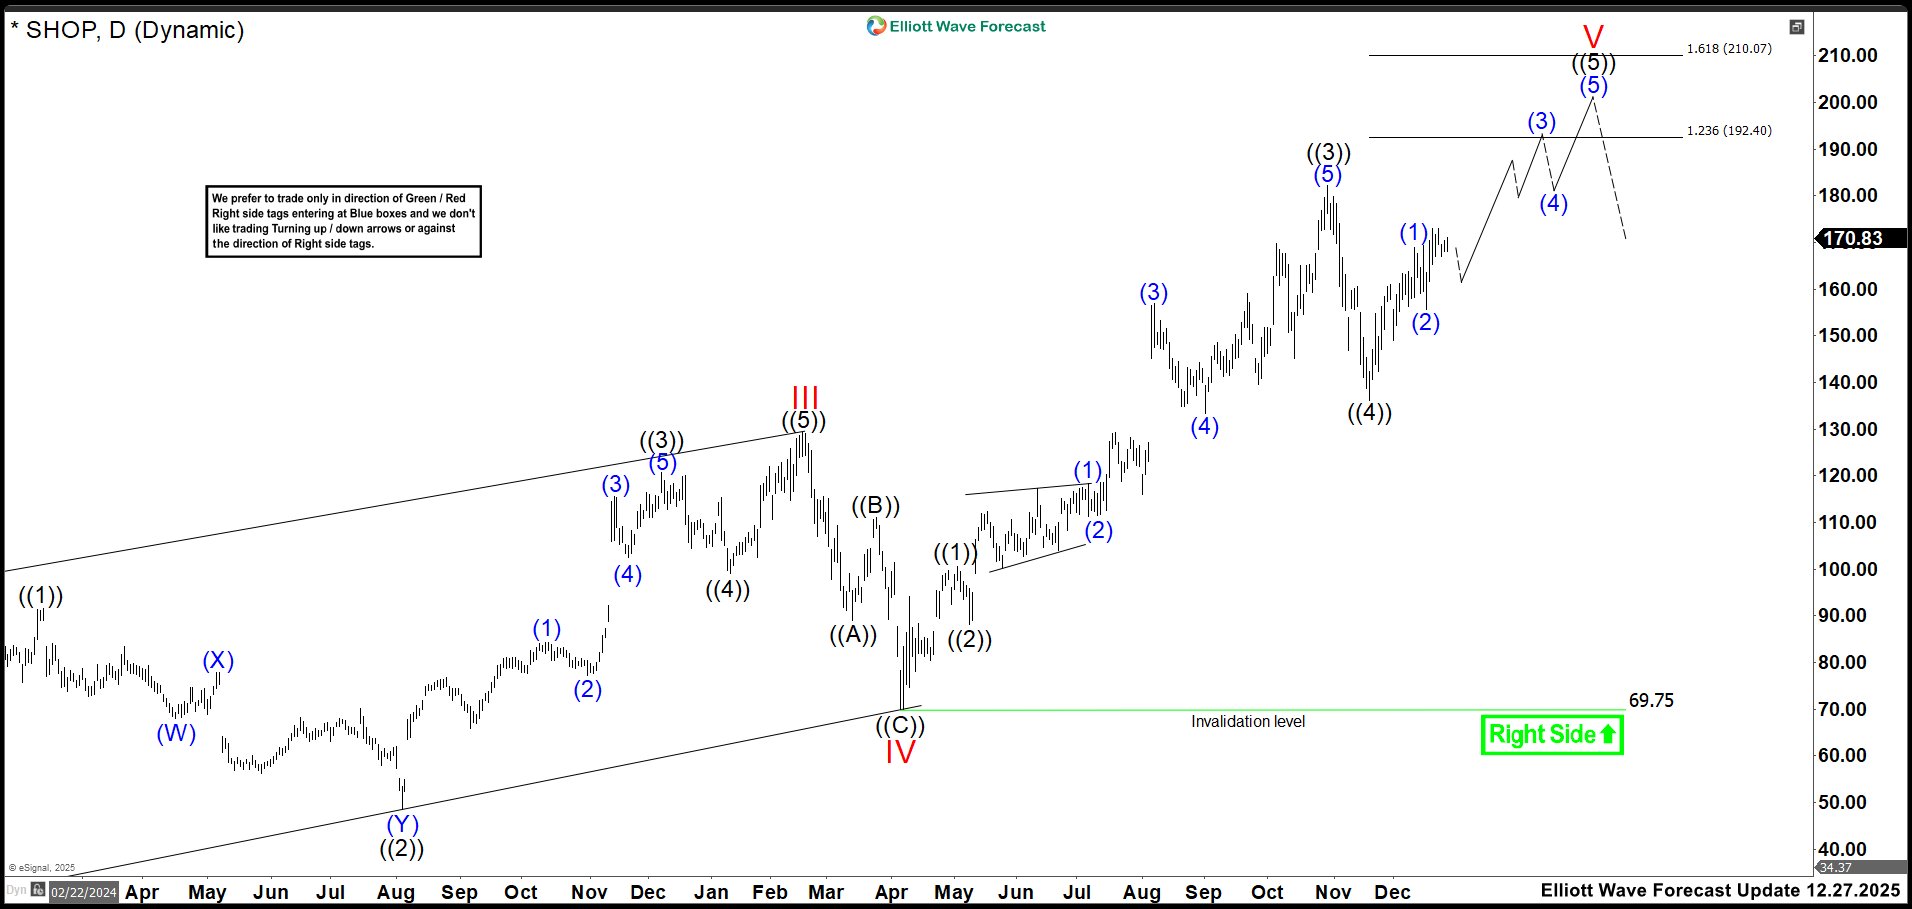
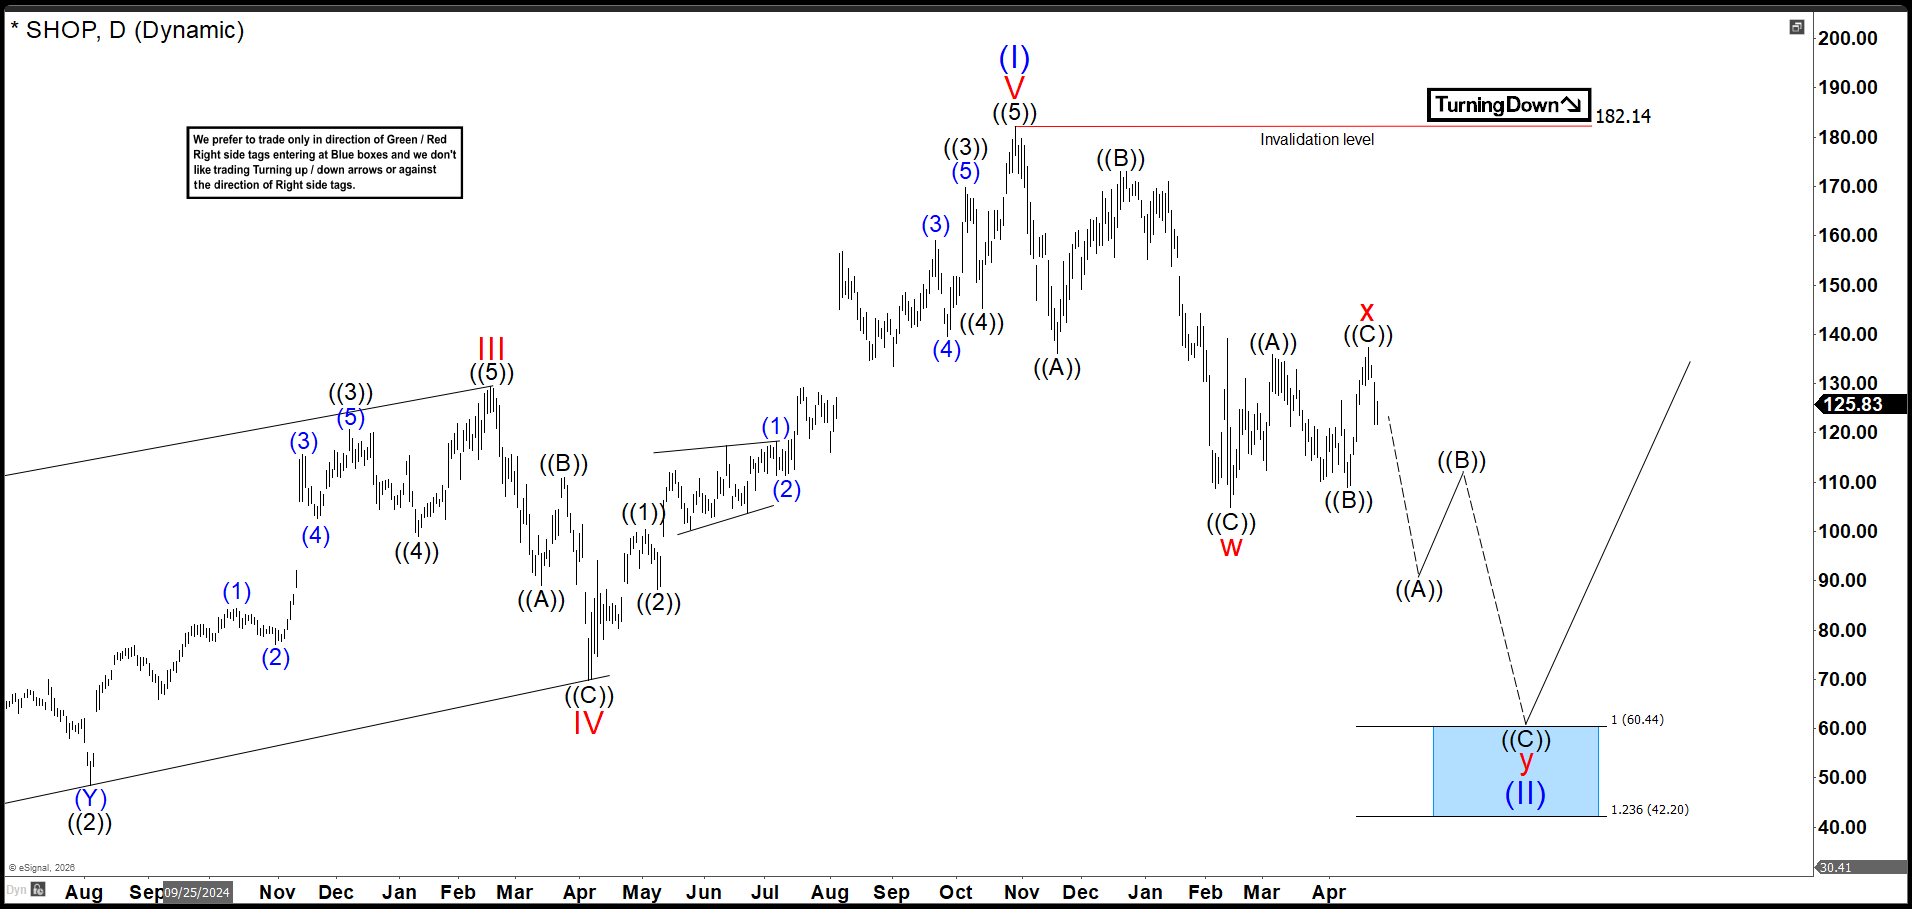
SHOP Breakdown: Wave (II) Scenario Gains Strength After Weak Rebound
Shopify's (SHOP) stock has been experiencing a bit of a downturn recently, and investors are eager to see what the second and third quarters of the year will hold. Analysts expect that the company will focus on refining its e-commerce tools and expanding its merchant solutions. Consequently, there’s