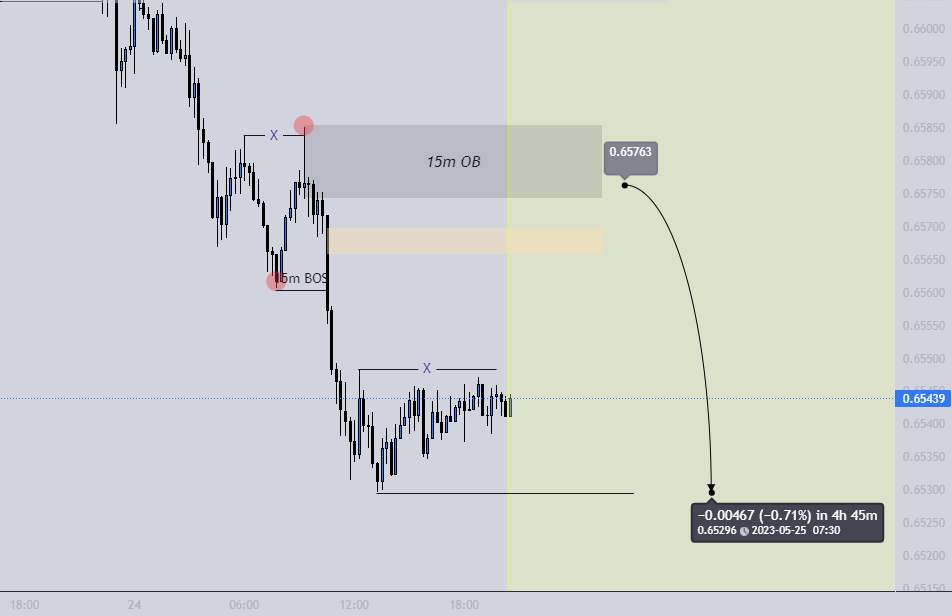
AUDUSD- SHORT
Liquidity sweep and structure break down, creating a strong order block to seek the sale.
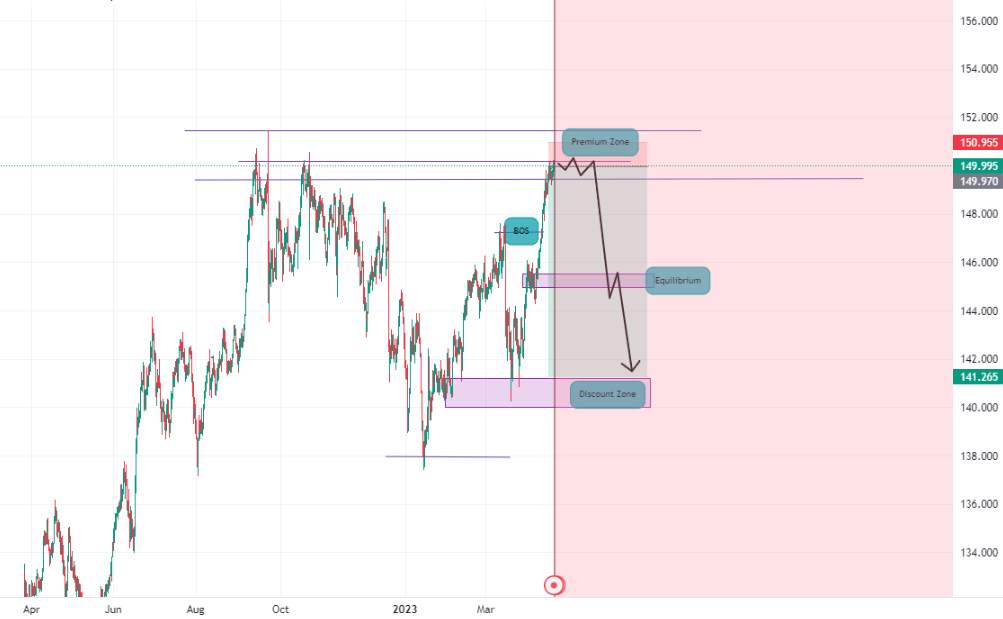
CHFJPY Potential Short
CHFJPY has reached the resistance level. Wait for bearish confirmation then short this market.
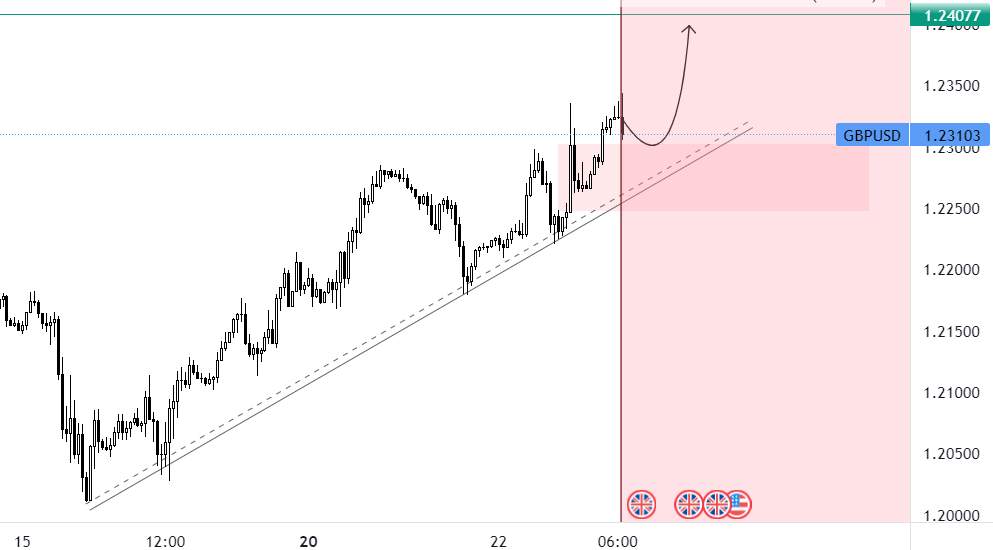
gbpusd long
As i see the chart is in a strong bullish trend and expected to go higher my target for short term will be 1.24000 will be great to enter buy order in the next higher low with tight stops.
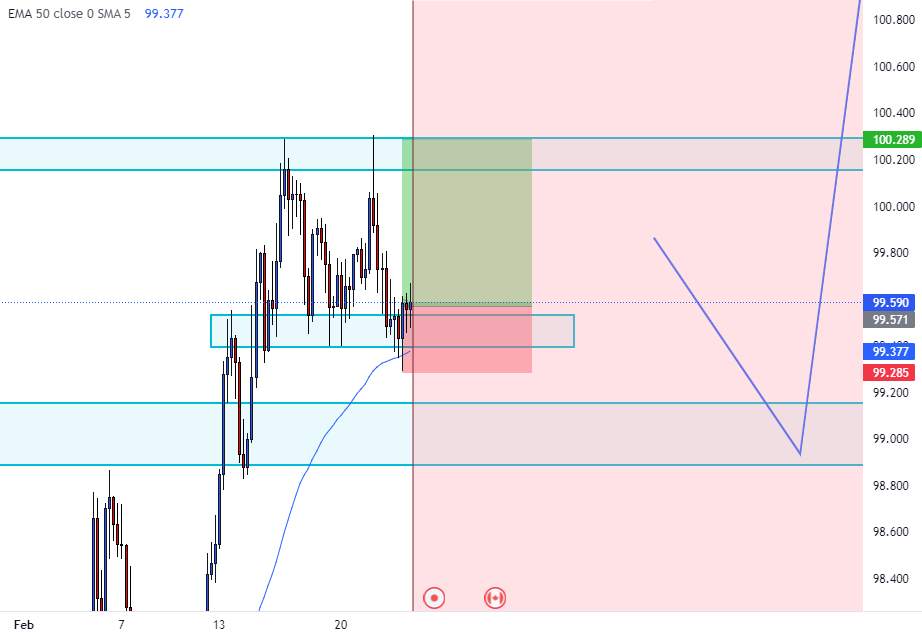
Long Trade on CADJPY
Where are in a bull market on CADJPY and we hit in the 4H timeframe a support and then we have a bullish engulfing in it and the touch on EMA 50
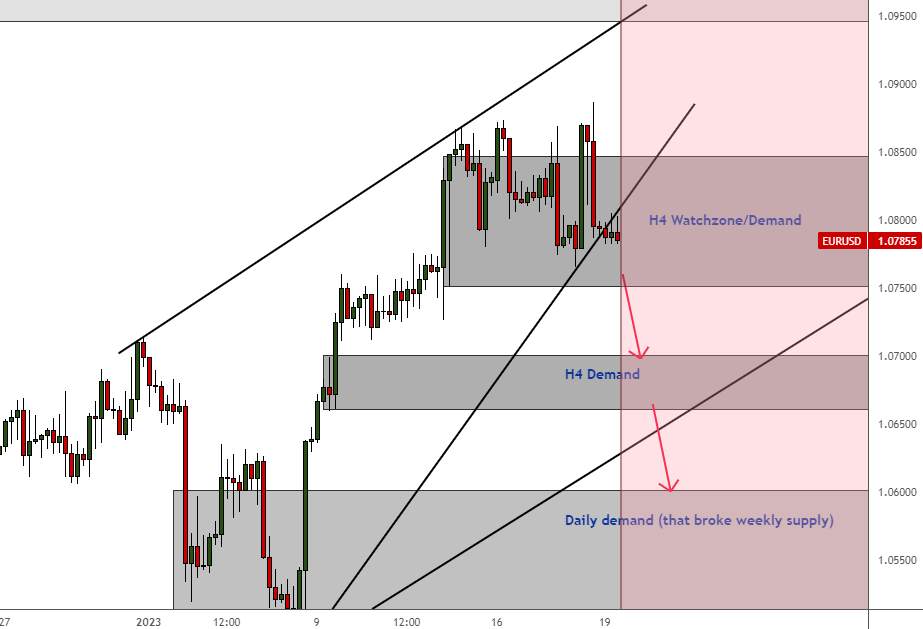
EURUSD SHORT!
Although price is still creating Higher Highs which is indicative of the overall trend being bullish , it looks like we might be getting some nice pullbacks provided this current H4 Watchzone/Demand is broken. I hope you will be patient enough to wait for the break and pullback before shorting.
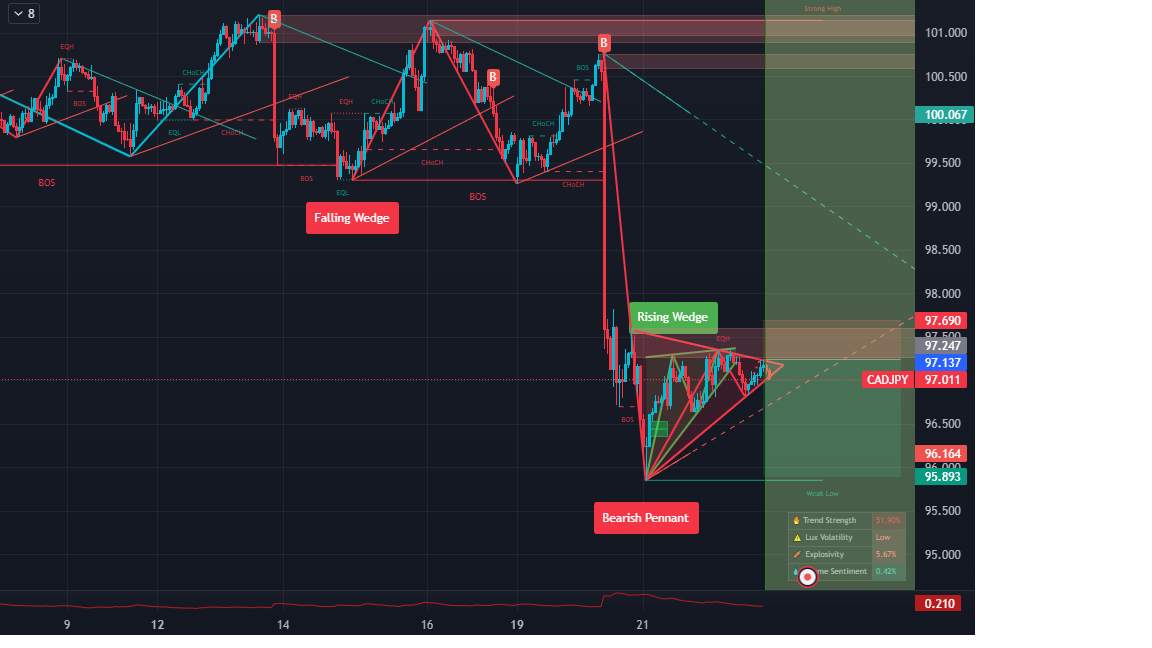
CADJPY - POTENTIAL SHORT ENTRY
Price is approaching towards an order block where resistance is lurking, creating a potential opportunity for a sell. Impulse Short entries can be taken once price rejects that region. Rising Wedge and Bearish Pennant formations has occurred, which signifies a potential bearish breakout soon. We had

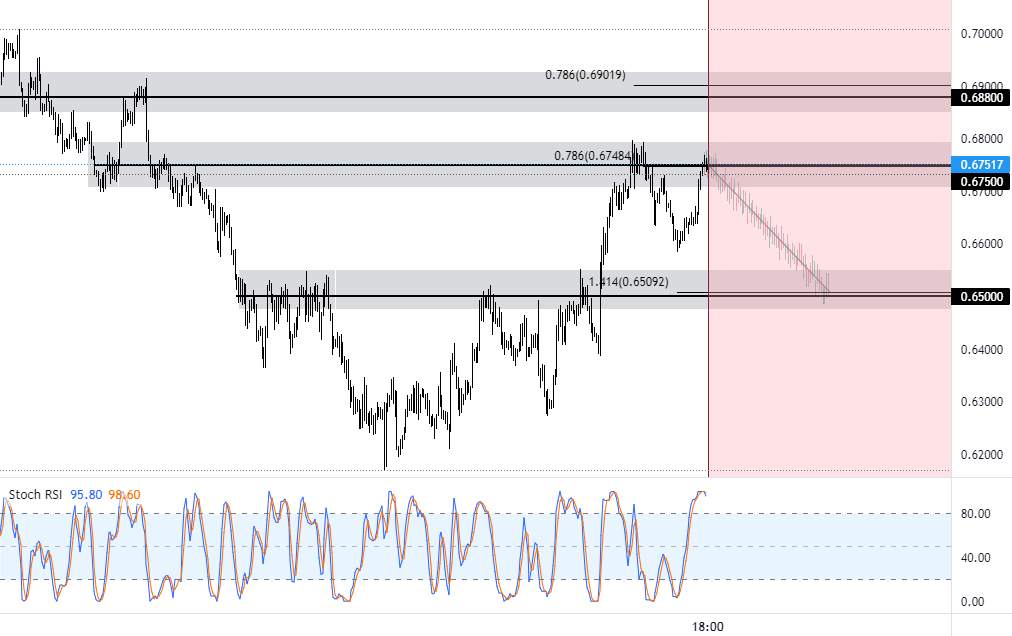
Bearish outlook on AUDUSD: 24th November 2022
On the H4 timeframe, prices are facing bearish pressure from its resistance area at 0.67500, in line with the 78.6% Fibonacci retracement . The pullback to this zone presented an opportunity to play further drop to the next support target at 0.65000, in line with the 141.4% Fibonacci retracement . S
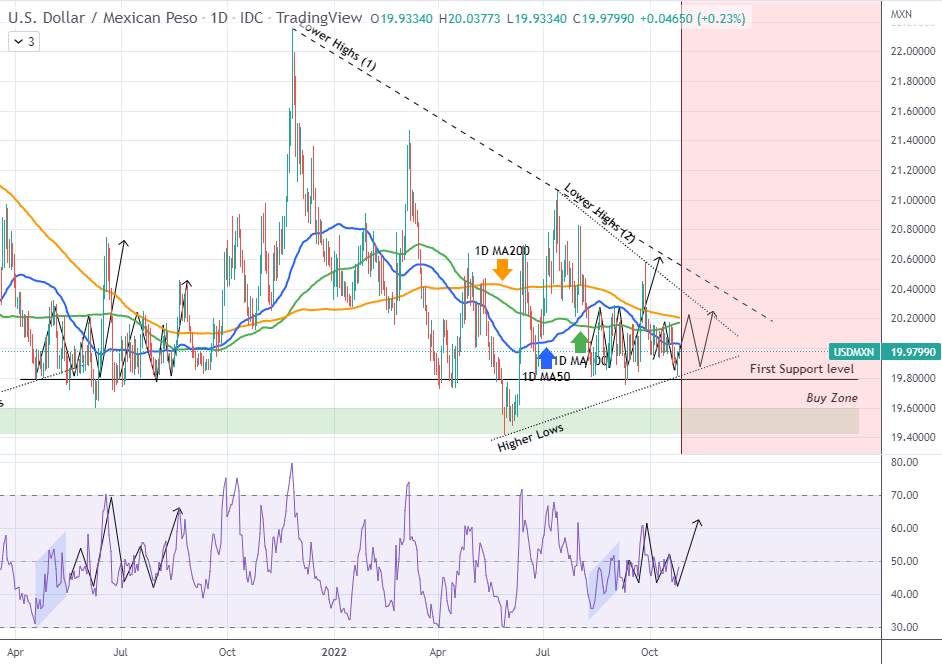
USDMXN Confirming our long-term pattern. Strong Buy now!
We made this accurate projection based on the similarities with the April - June 2021 fractal . The correlation continues to hold as the price is now trading sideways near the Support level , having broken last Friday below its 1D MA50 (blue trend-line). As per the 2021 sequence, we can expect anoth
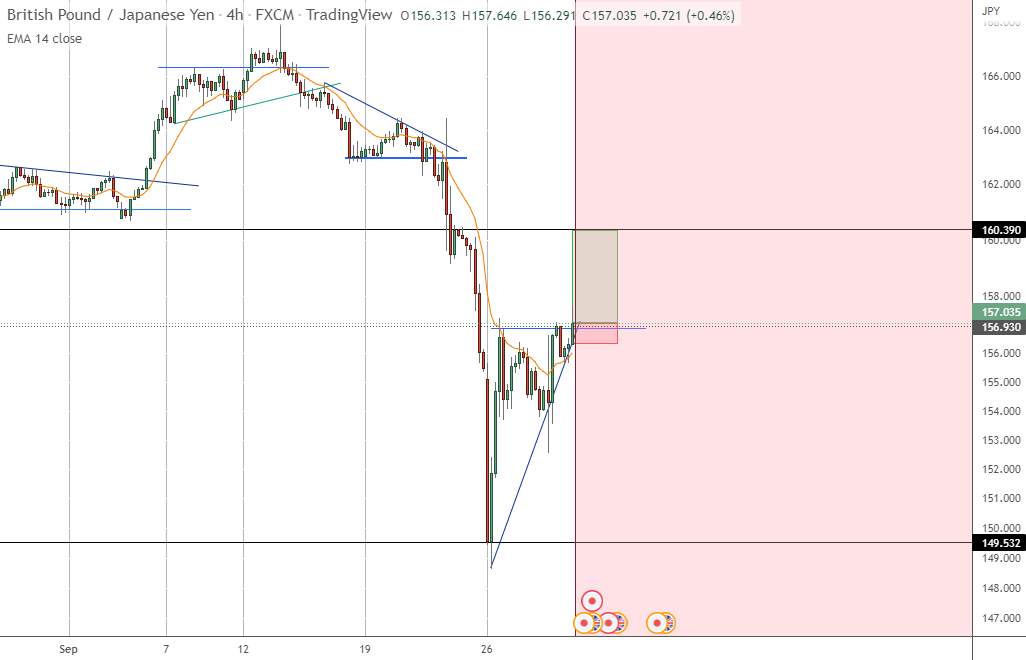
GBPJPY
gbpjpy tuần trước thật điên rồ đã có một vụ tai nạn lớn vì nữ hoàng Anh vừa qua đời, nhưng bây giờ chúng tôi đã trở lại bình thường và chúng tôi thấy một dạng mô hình đỉnh kép và gi&aacu
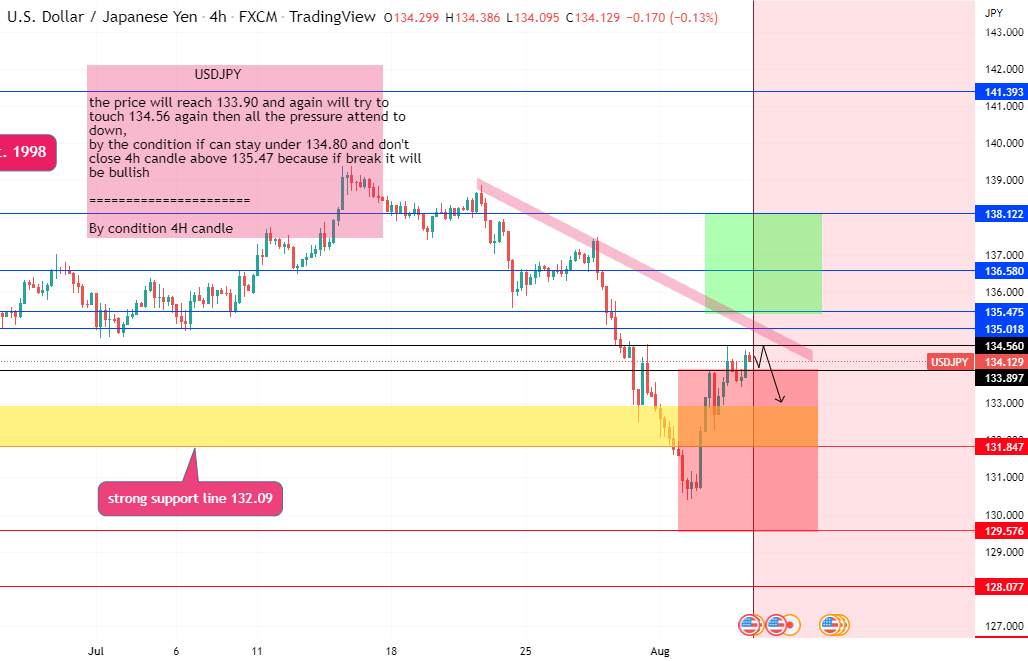
USDJPY 4h (down-side)
The price will reach 133.90 and again will try to touch 134.56 again then all the pressure attend to down, by the condition if can stay under 134.80 and don't close 4h candle above 135.47 because if break it will be bullish
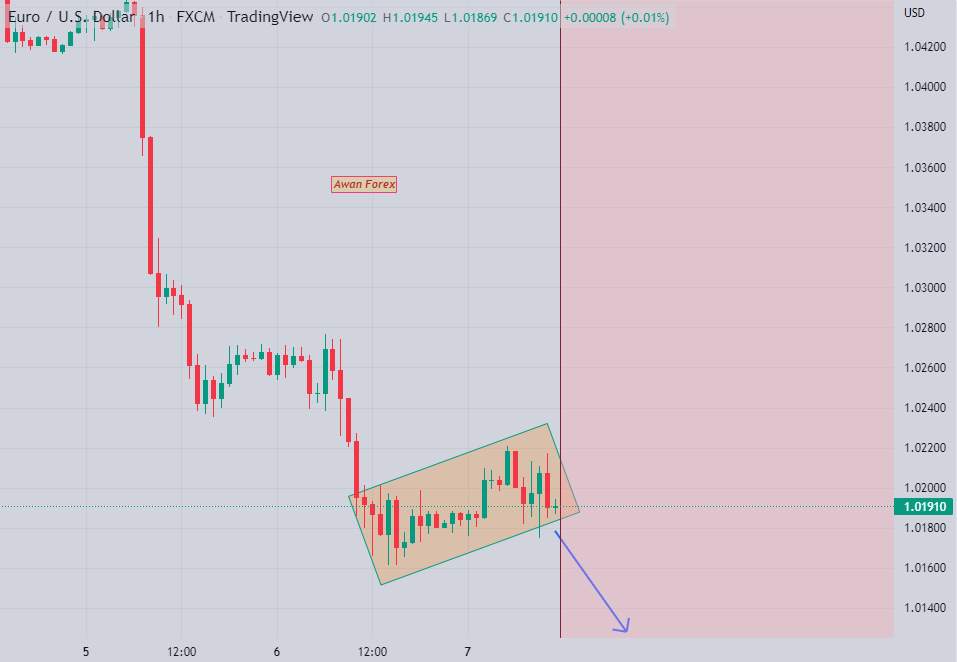
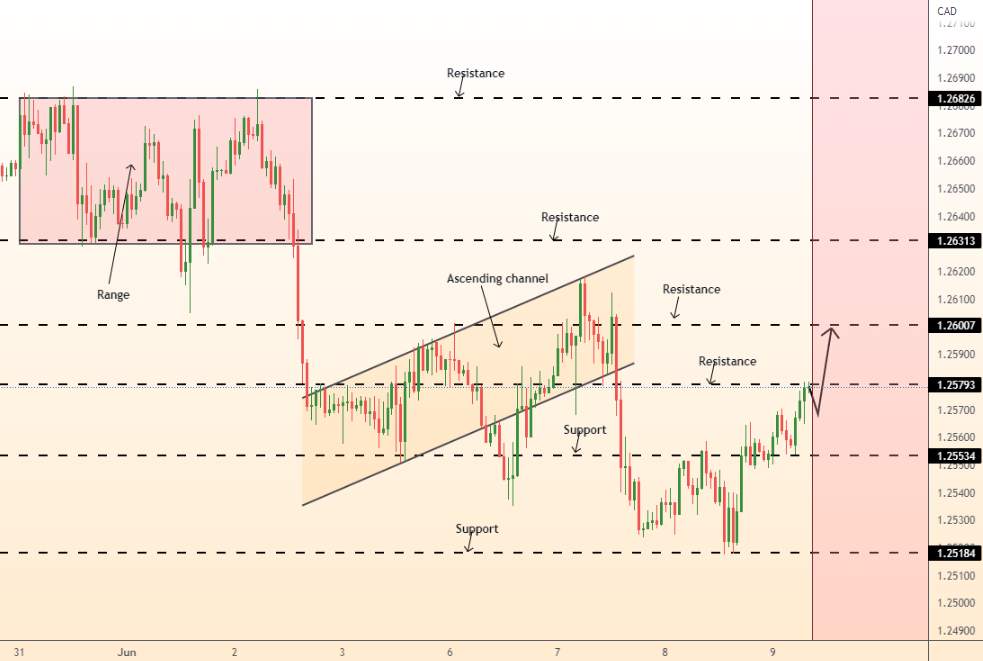
USDCAD bullish opportunity
USDCAD tested the major support level 1.25200. Price action is forming an expanding triangle. We expect a test of the psychological level 1.26000.
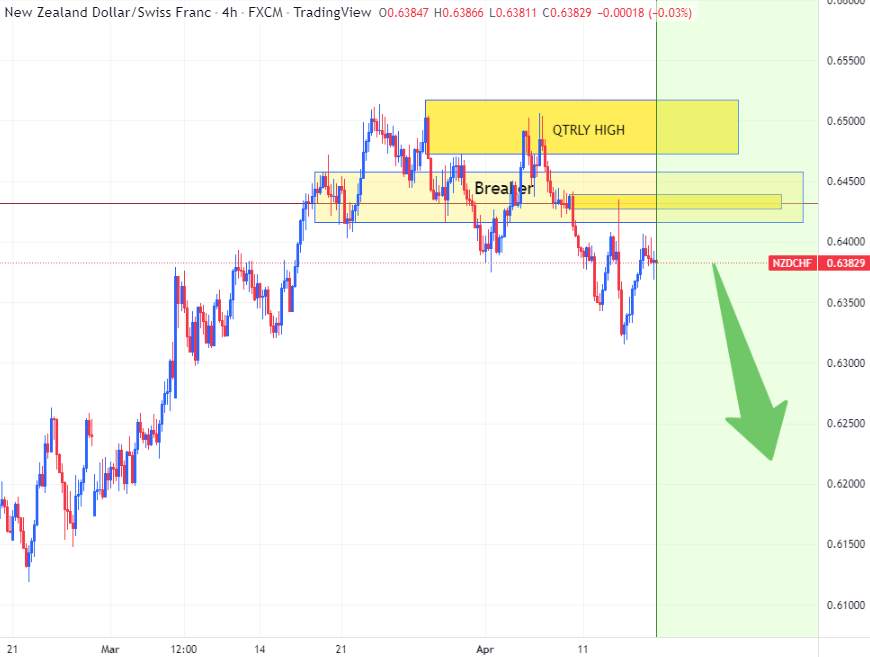
Sell NZDCHF
#OPINIONLEADER# After the price retested the Quarterly high we saw the price rally to the downside and the downtrend was confirmed by the breaker block that was created. I am anticipating that there will be a continuation to the downside so the liquidity void below can be filled.
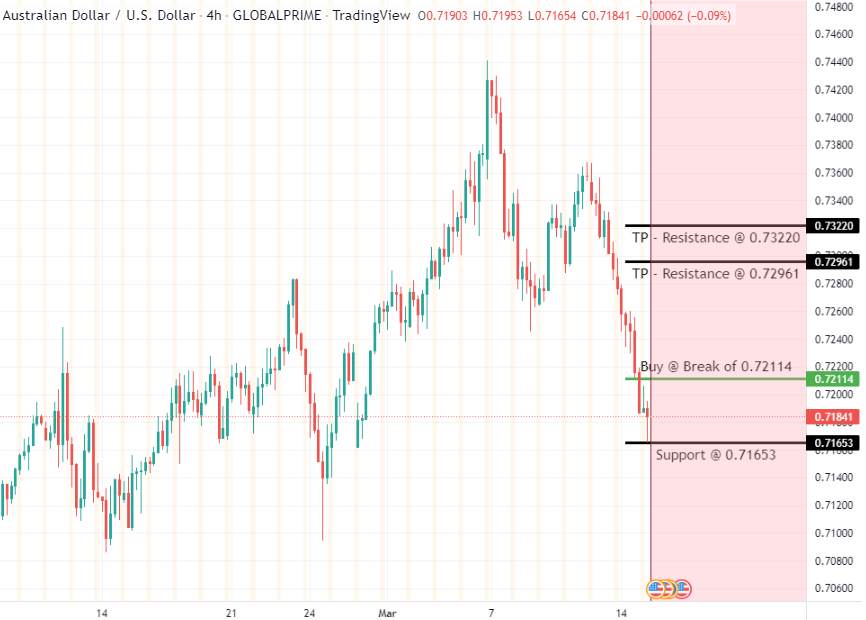
AUDUSD LONG - Buy Entry - H4 Chart
AUDUSD LONG - Buy Entry - H4 Chart Buy @ Break of 0.72114 Symbol: AUDUSD Timeframe: H4 Type: BUY Entry Price: Buy @ Break of 0.72114 Resistance Becomes Support @ 0.72114 TP - Resistance @ 0.72961 TP - Resistance @ 0.73220 Support @ 0.71653 NFA #OPINIONLEADER#
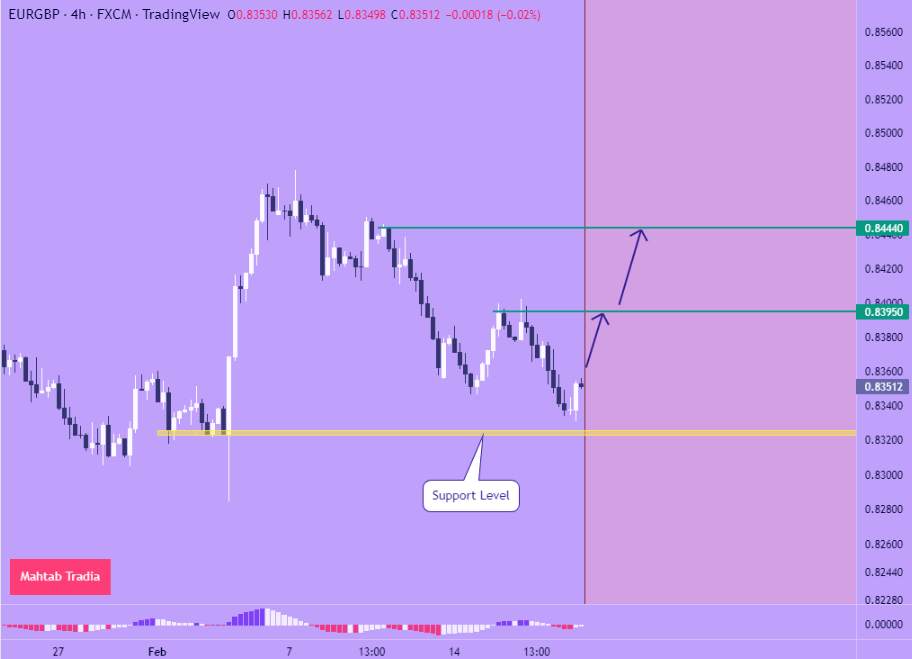
EURGBP Upside Pressure
As you see in the 4H chart, price is in a downtrend and has approached to the yellow support level . If we take a look at the price structure, we can see that there was a sharp uptrend first, then price has started a downtrend. Currently, price failed to break the last major low at 0.8323, and is pu