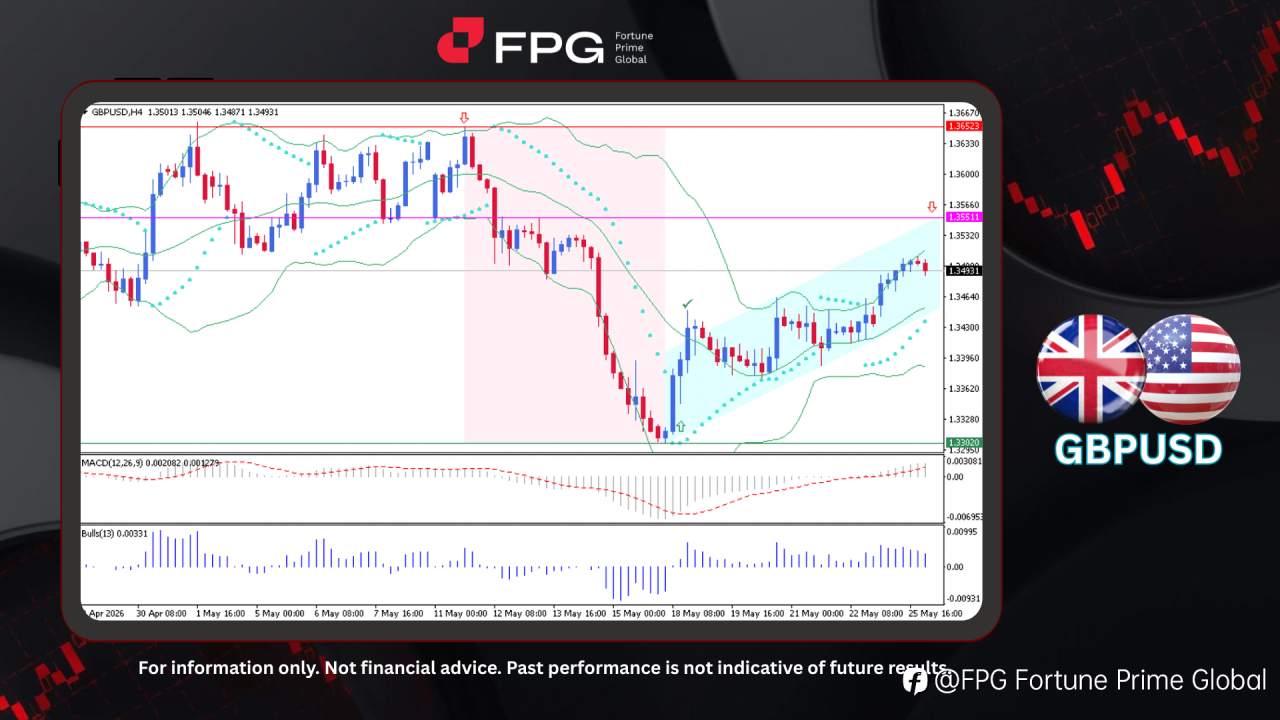
FPG GBPUSD Market Report May 26, 2026
On the H4 timeframe chart, GBPUSD is currently showing signs of recovery while gradually forming a bullish trend structure after previously experiencing a significant bearish decline from 1.3652 down to 1.3302. Following that sharp selloff, the market successfully established a strong rebound from t
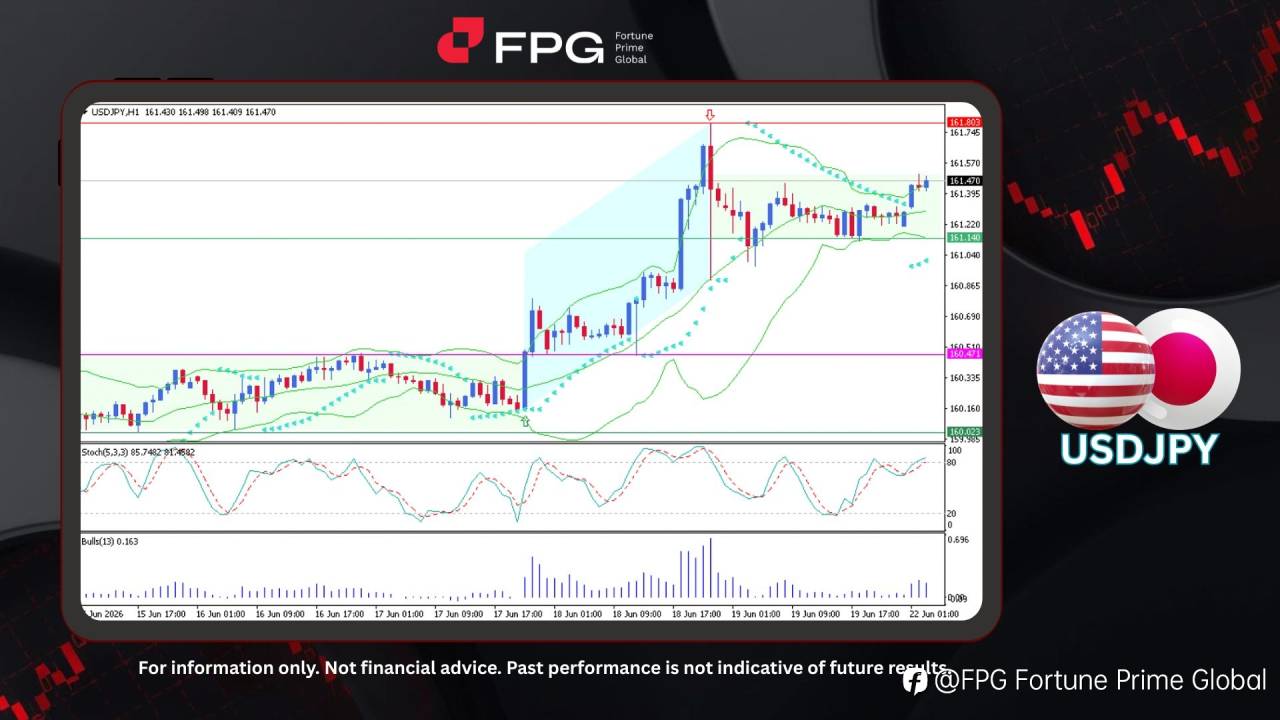
FPG USDJPY Market Report June 22, 2026
On the H1 timeframe chart, USDJPY has recently entered a consolidation phase after experiencing a strong bullish movement from the 160.16 support area toward the 161.80 resistance zone. Previously, price action was moving sideways between 160.02 and 160.47 before breaking higher and forming a bullis
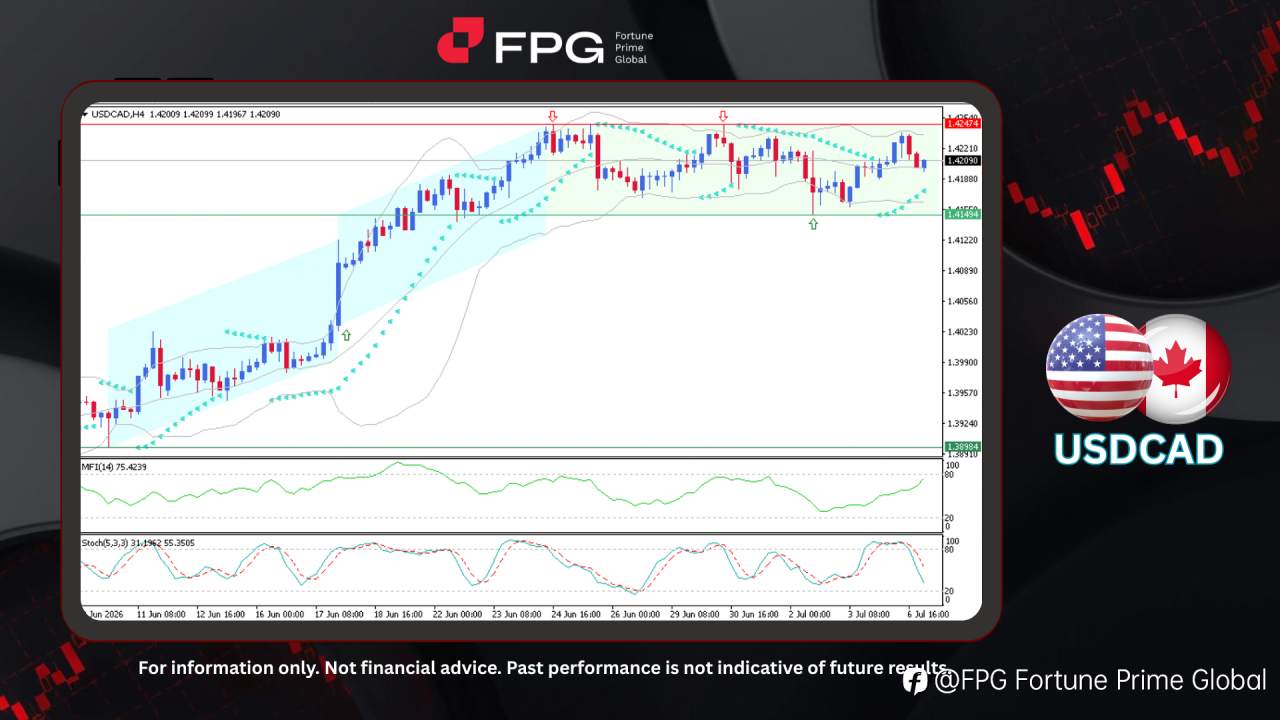
FPG USDCAD Market Report July 7, 2026
On the H4 timeframe, USDCAD is currently trading within a well-defined sideways consolidation after completing a strong bullish rally that peaked at 1.4247. Following the rally, price entered a stabilization phase, fluctuating between support at 1.4149 and resistance at 1.4247 as buying and selling
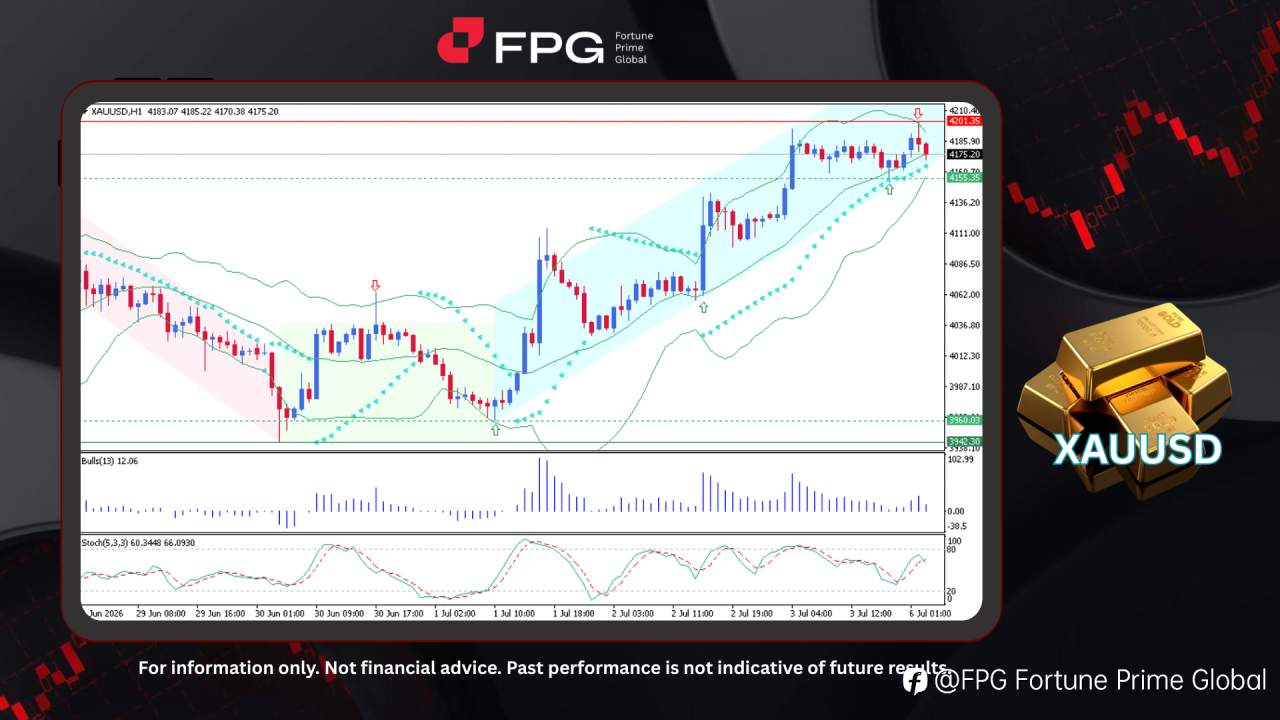
FPG XAUUSD Market Report July 6, 2026
On the H1 timeframe, XAUUSD (Gold) continues to trade within a well-defined bullish trend. Following the previous bearish decline that pushed prices down to the 3,942 support level, gold entered a period of sideways consolidation before regaining upward momentum. The current bullish move began aroun



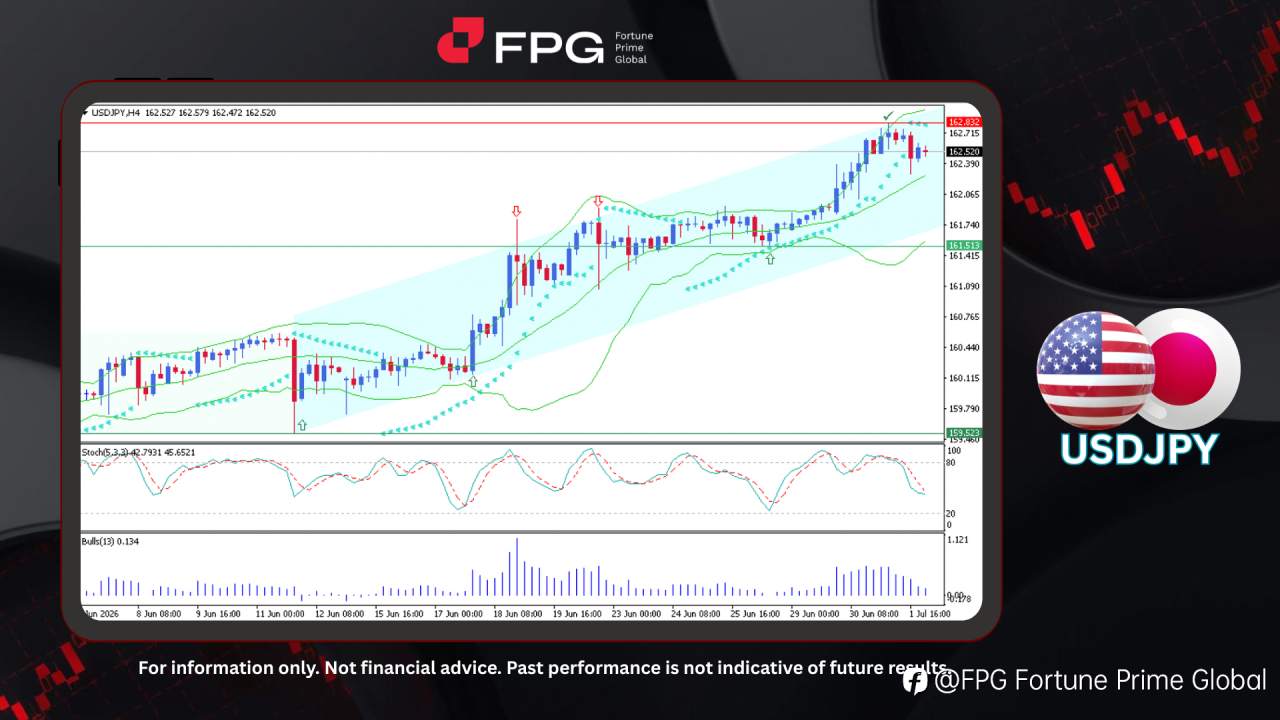
FPG USDJPY Market Report July 2, 2026
On the H4 timeframe chart, USDJPY continues to maintain strong bullish momentum as the Yen remains under pressure, reaching its weakest level against the U.S. dollar in approximately 40 years. The pair continues its upward movement from the 159.52 support level while trading within a clear ascending
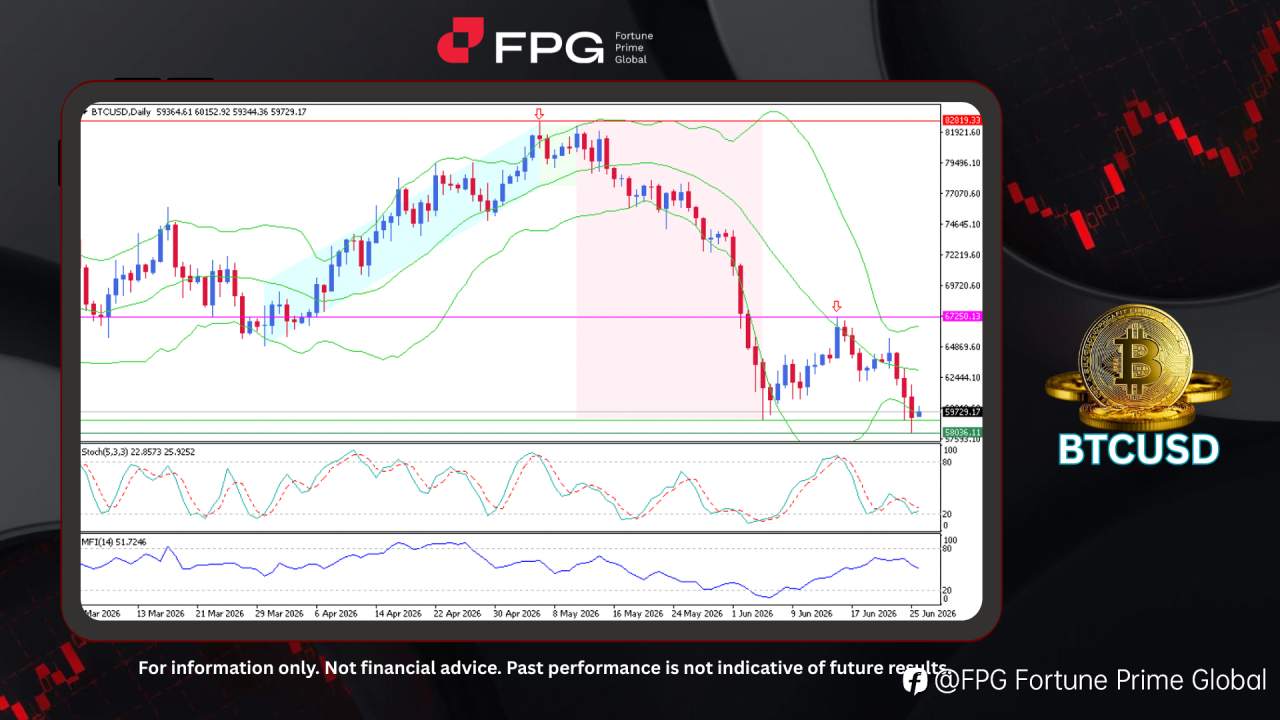
FPG BTCUSD Market Report June 26, 2026
On the Daily timeframe chart, BTCUSD has recently broken below the key 60,000 level, reaching a low that was last seen around September of last year. As shown on the chart, the bearish trend started from the 82,819-resistance area, followed by a consistent series of red candles reflecting strong sel


FPG EURGBP Market Report June 23, 2026
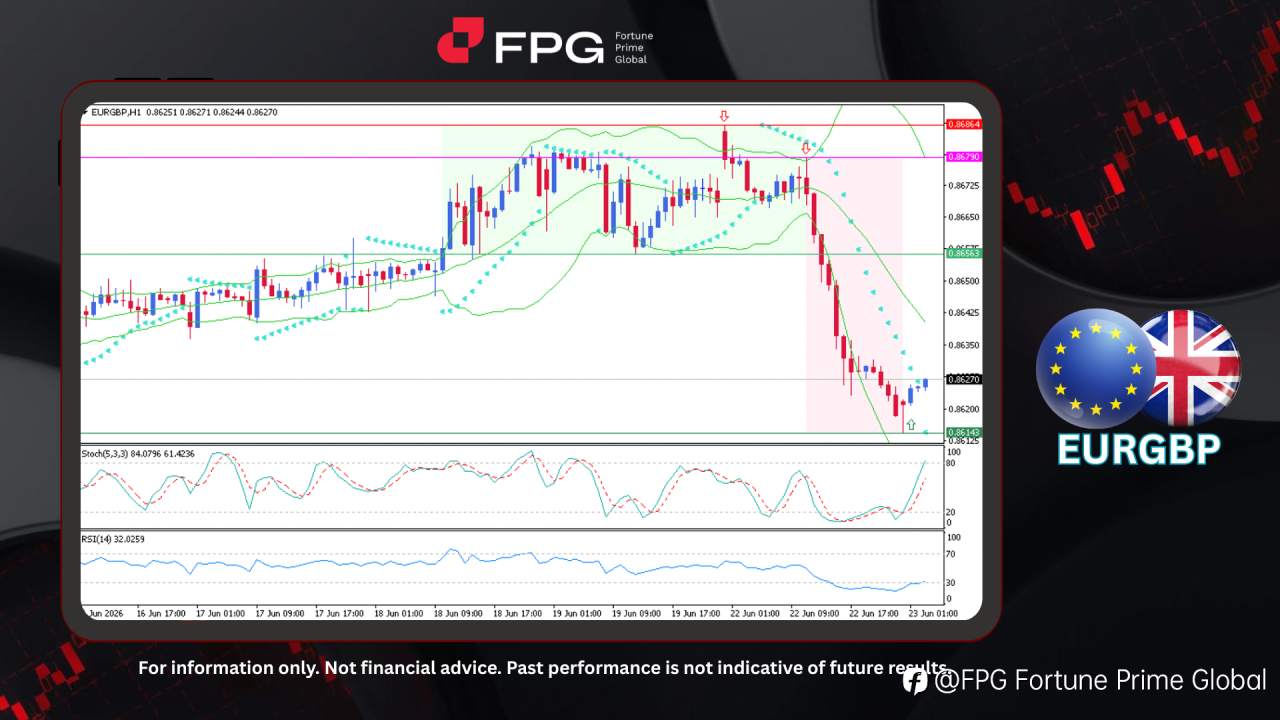
On the H1 timeframe chart, EURGBP has recently experienced a significant bearish movement after failing to sustain momentum near the upper boundary of its previous consolidation range. Price declined sharply from the 0.8679 resistance area toward the 0.8614 support zone, breaking below the previous
FPG USDCAD Market Report June 17, 2026
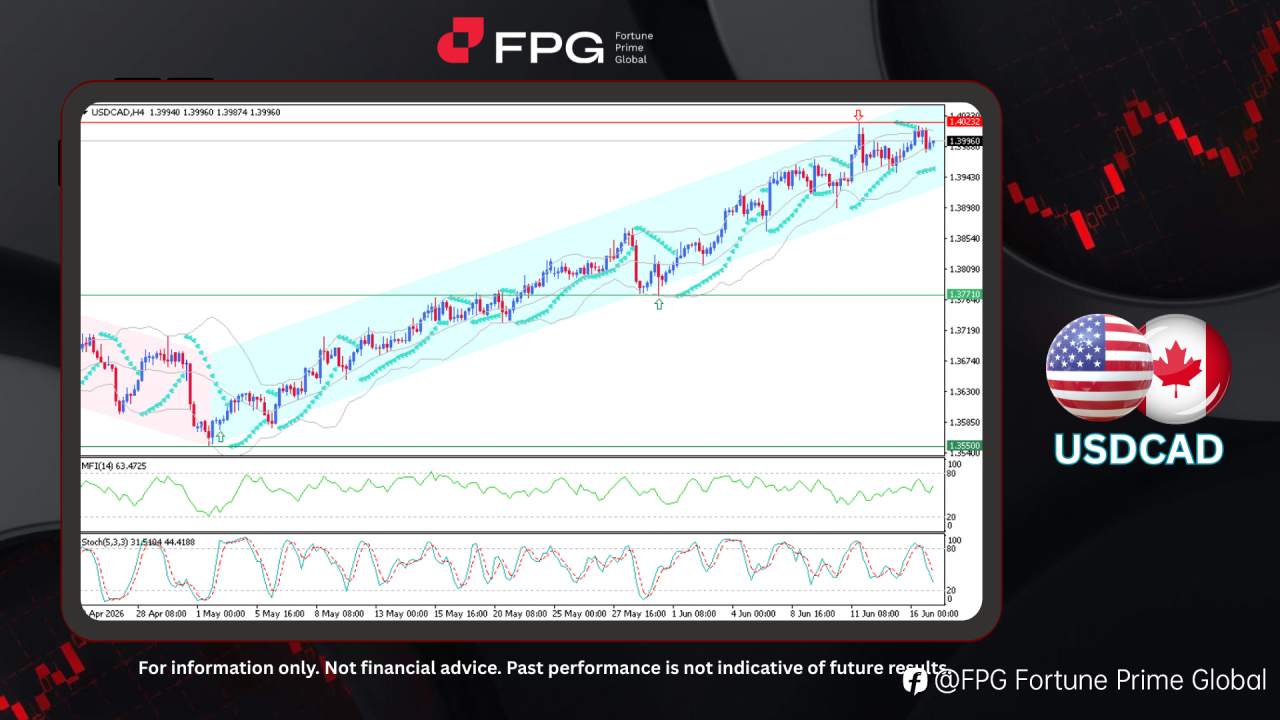
On the H4 timeframe chart, USDCAD continues to exhibit a strong and well-established bullish trend. The upward movement originated in early May following a decisive trend reversal from bearish to bullish near the 1.3550 level. Since then, the pair has advanced steadily within a well-defined ascendin
FPG AUDUSD Market Report June 16, 2026
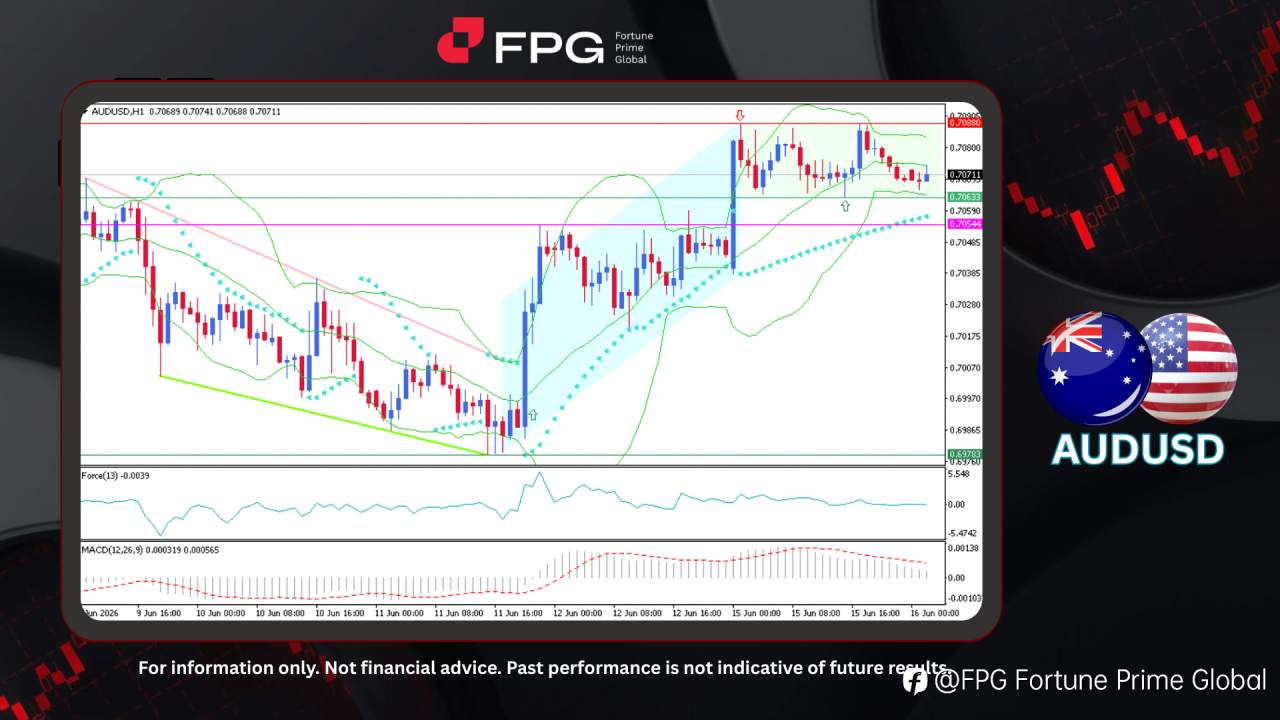
On the H1 timeframe chart, AUDUSD staged a strong bullish recovery from the 0.6978 area last week before losing momentum and entering a consolidation phase below the 0.7088 resistance level. Following the rally, price action has become more range-bound, with the pair fluctuating between support at 0
FPG EURUSD Market Report June 9, 2026
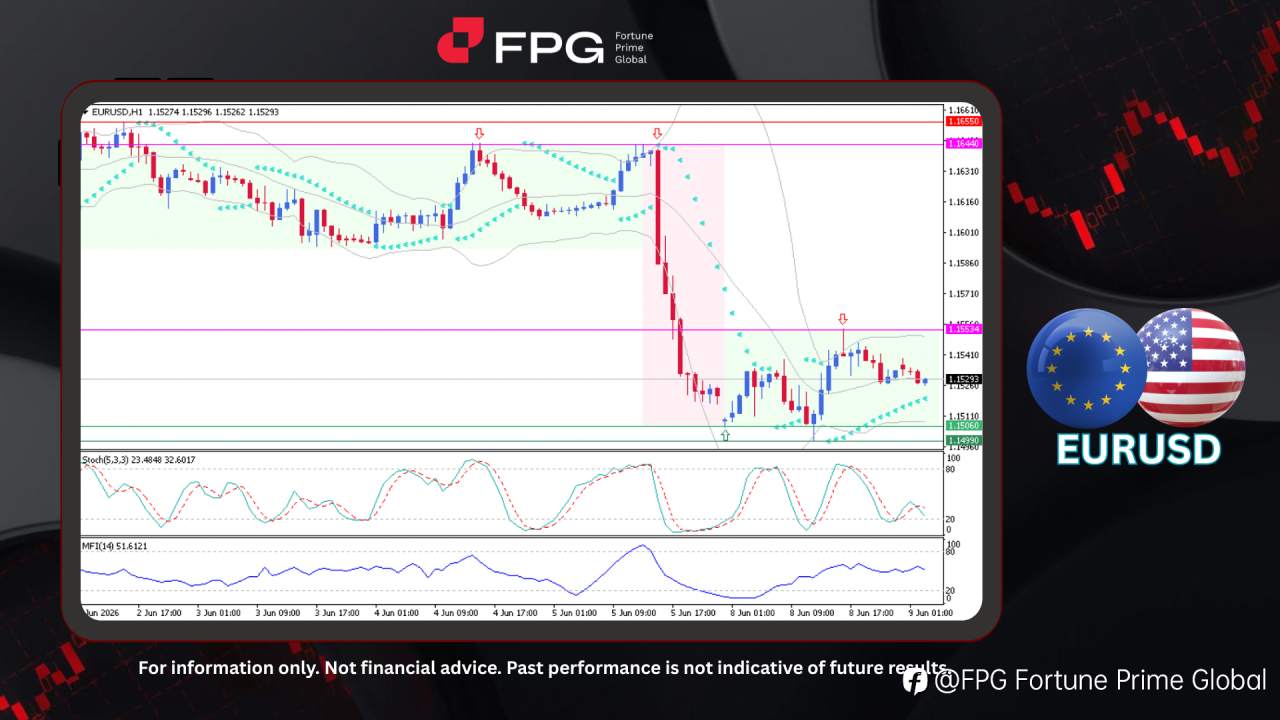
On the H1 timeframe chart, EURUSD has recently experienced a significant bearish breakdown after failing to sustain movement above the 1.1644 resistance area. Previously, the pair was moving within a relatively stable sideways range before strong selling pressure emerged and pushed price sharply low

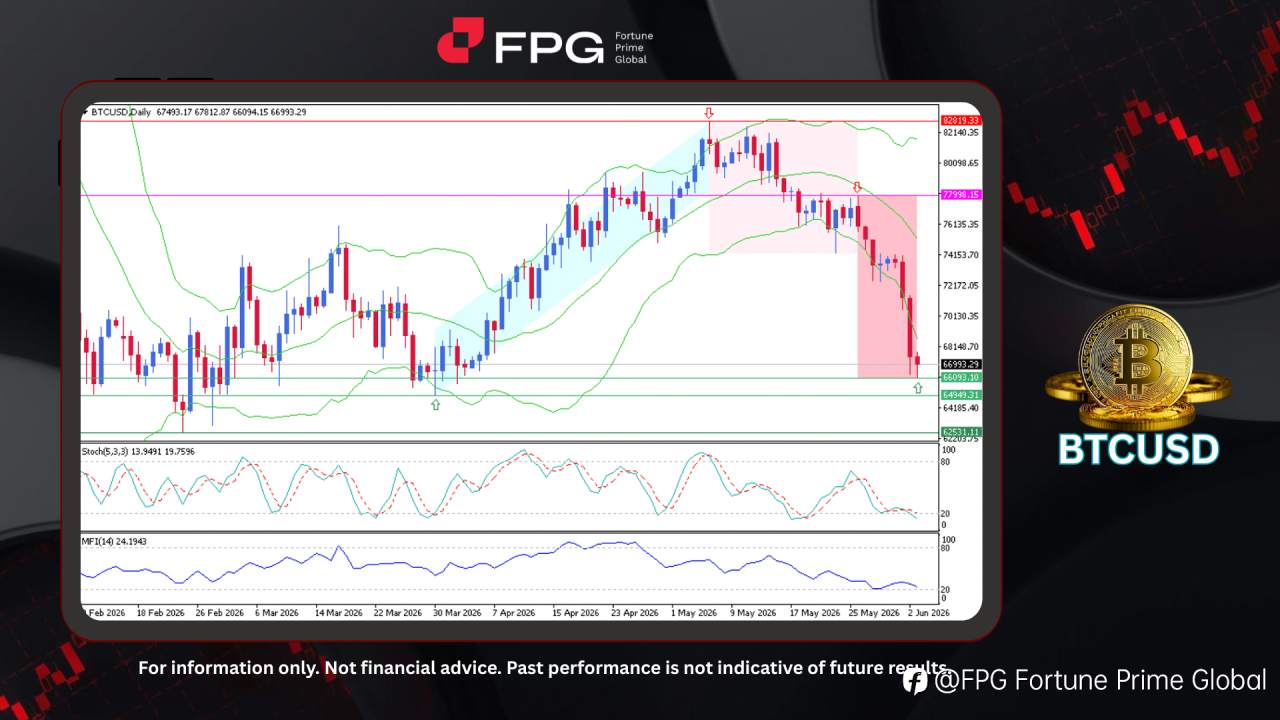
FPG BTCUSD Market Report June 3, 2026
On the Daily timeframe chart, BTCUSD has experienced a significant bearish decline, falling from the 77,998 resistance area toward 66,093 after previously reaching a major peak around 82,819. Following the failure to sustain bullish momentum near the upper resistance zone, Bitcoin entered a clear re
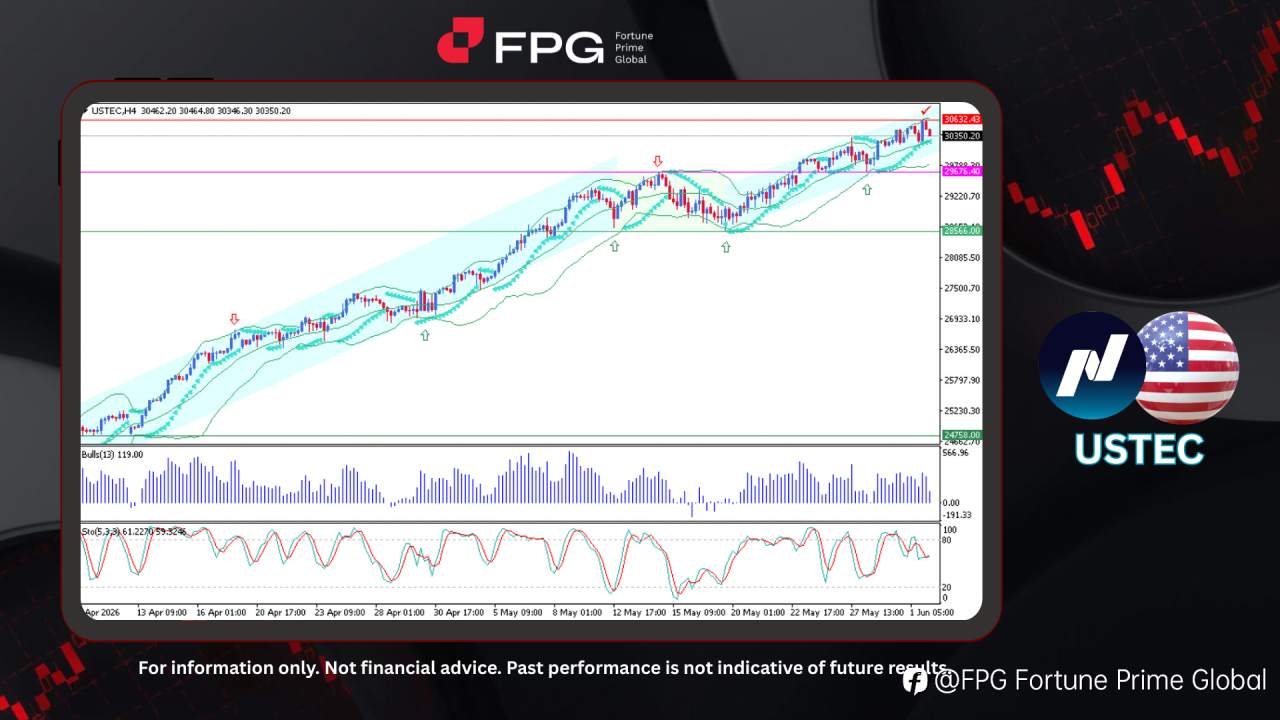
FPG USTEC Market Report June 2, 2026
On the H4 timeframe chart, USTEC (Nasdaq-100) appears to be continuing its bullish rally after previously experiencing a temporary loss of momentum. As shown on the chart, USTEC has been in a strong and extended bullish trend for several months, forming a well-defined ascending channel. However, the