


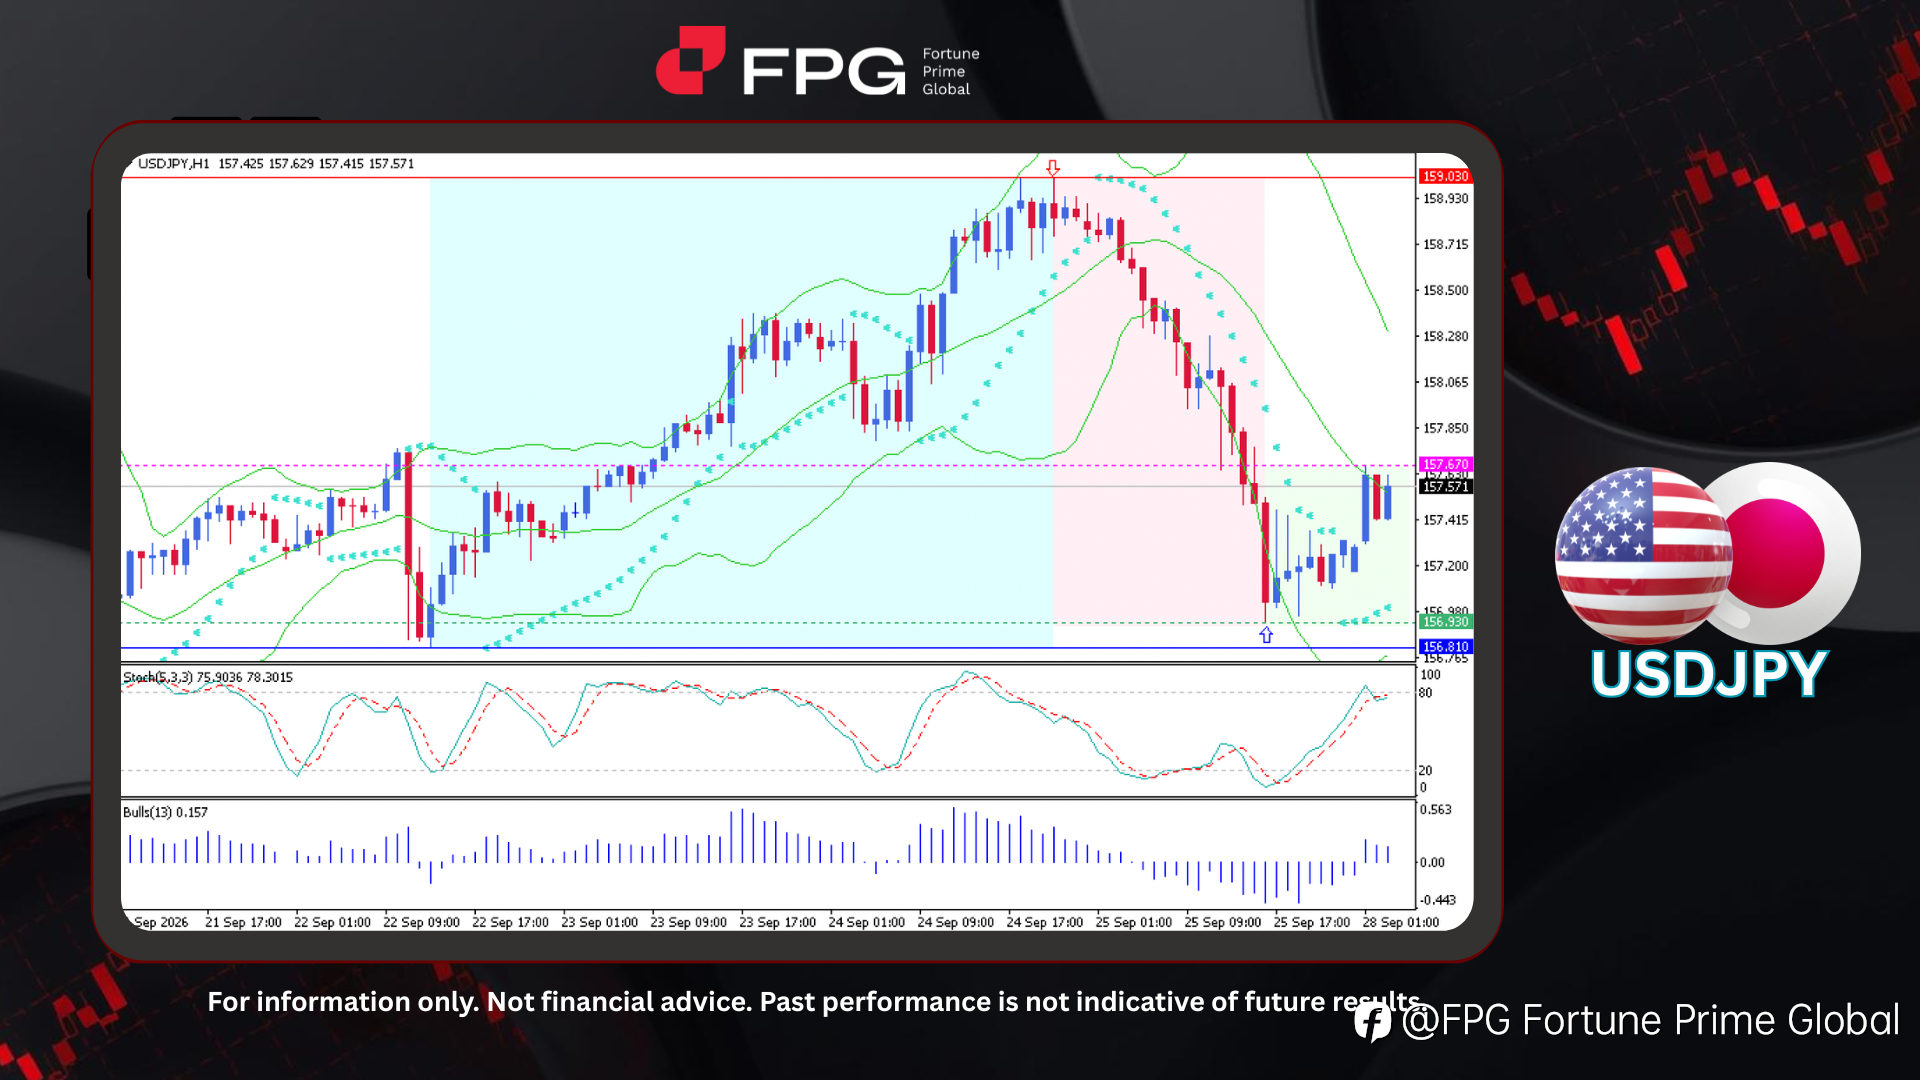
On the H1 chart, USDJPY has experienced significant volatility and a clear trend reversal over the past week. The pair initially rallied from 156.81 to a high of 159.03 before reversing sharply and declining to 156.93. Since reaching that low, price has entered a consolidation phase, fluctuating between 156.93 and 157.67. The current price is around 157.57, close to the upper boundary of this range.
Technical indicators reflect a market that is gradually stabilizing after the recent volatility. The Bollinger Bands remain relatively wide following the sharp rally and subsequent sell-off, although they have started to narrow as price consolidates. The Parabolic SAR has shifted below the candles, indicating that short-term upward momentum has emerged following the rebound from 156.93. Meanwhile, the Stochastic oscillator (5,3,3) stands at 75.90 and 78.30, approaching the overbought threshold of 80 and suggesting that upside momentum may face resistance near 157.67. Bulls Power (13) has also returned to positive territory at 0.157, indicating a modest recovery in buying pressure, although the reading remains insufficient to confirm a decisive bullish breakout.
From a fundamental perspective, the US dollar continues to receive support from resilient economic conditions and elevated Treasury yields, while expectations for a relatively restrictive Federal Reserve policy remain a supportive factor. In Japan, policymakers continue to monitor yen weakness closely, keeping the possibility of intervention in focus as USDJPY remains elevated. Diverging monetary policy expectations between the Federal Reserve and Bank of Japan, alongside developments in global inflation and oil prices, continue to create opposing forces for the pair. Against this backdrop, USDJPY appears to be consolidating ahead of its next directional move, with upcoming economic data and central-bank signals likely to influence the broader trend.
Technical Market Overview
1. Current Position: USDJPY is trading near 157.57 on the H1 chart, close to the upper boundary of the 156.93–157.67 consolidation range. After reaching 159.03, the pair underwent a sharp reversal before stabilizing and moving sideways within a defined range.
2. Resistance Zone: Immediate resistance is positioned at 157.67, which marks the upper boundary of the current range and has recently attracted selling pressure. A sustained break above this level could shift attention toward the 158.00–158.28 area, followed by the recent high at 159.03.
3. Support Zone: Initial support is located at 156.93, which represents both the recent swing low and the lower boundary of the current range. A secondary support level is found at 156.81, while a break below this area could indicate renewed downside pressure.
4. Indicator Observation: The Bollinger Bands remain relatively wide but are beginning to contract as volatility moderates. The Parabolic SAR is positioned below the candles, indicating emerging short-term upward momentum. The Stochastic oscillator (5,3,3) at 75.90 and 78.30 is approaching the overbought threshold of 80, suggesting that upside momentum may be losing room to extend. Bulls Power (13) has turned positive at 0.157, reflecting a modest improvement in buying pressure, although the reading remains relatively subdued.
5. Technical Summary: USDJPY is in a consolidation phase following a sharp reversal, with the 156.93–157.67 range defining the near-term boundaries. Short-term bias is neutral to mildly bullish, but the pair needs a clear break above 157.67 to confirm upside continuation. Failure to clear this resistance, combined with a stochastic reading near overbought, could lead to a retest of 156.93 support.
Market Performance:
Forex Last Price % Change
EUR/USD 1.1379 −0.11%
GBP/USD 1.3231 −0.10%
Key Economic Calendar:
JP: BoJ Monetary Policy Meeting Minutes
US: Dallas Fed Manufacturing Index
Risk Disclaimer: This report is for informational purposes only and does not constitute financial advice. Investments involve risks, and past performance does not guarantee future results. Consult your financial advisor for personalized investment strategies.
#trading##FPG-FortunePrimeGlobal# #Todayanalysis# #FPG# #ForexForecast#
إخلاء المسؤولية: الآراء الواردة هنا تعبر فقط عن رأي الكاتب، ولا تمثل الموقف الرسمي لـ Followme. لا تتحمل Followme مسؤولية دقة أو اكتمال أو موثوقية المعلومات المُقدمة، ولا تتحمل مسؤولية أي إجراءات تُتخذ بناءً على المحتوى، ما لم يُنص على ذلك صراحةً كتابيًا.

