


Tags: #QuantDevelopment #USStocks #MarketAPI #WebSocket #Python
For quantitative traders and strategy researchers, a real‑time US stock dashboard is more than a visualization tool. It serves for live strategy observation, signal verification, and raw tick‑data collection for future backtesting. Many developers spend most of their effort polishing charts and UI effects, while overlooking critical data‑layer decisions around API field selection and timestamp processing. Poor data handling can break dashboard stability and introduce hidden bias into your backtesting datasets.
Early in one of my quant‑focused side projects, I decided to store every field returned by the market API. My reasoning was simple: preserve all raw data just in case I needed it for later research. As I added more stock tickers and continuous real‑time tick data streamed in, downsides quickly surfaced. Redundant fields increased storage costs, complicated data cleaning pipelines, and added extra preprocessing work for historical sample validation and backtesting workflows.
One practical lesson I learned: more available fields do not automatically produce better market tooling. We should select datasets according to clear objectives: live monitoring, tick‑level aggregation, and back‑test dataset construction. It is important to strike a balance between data completeness and engineering overhead.
Core Market Fields: Foundational Data for Monitoring & Backtesting
Both live dashboards and backtesting systems are built around each security’s live trading status. Last executed price, trading volume, and snapshot timestamps power visual outputs and act as source material for candle‑bar generation and historical sample building.
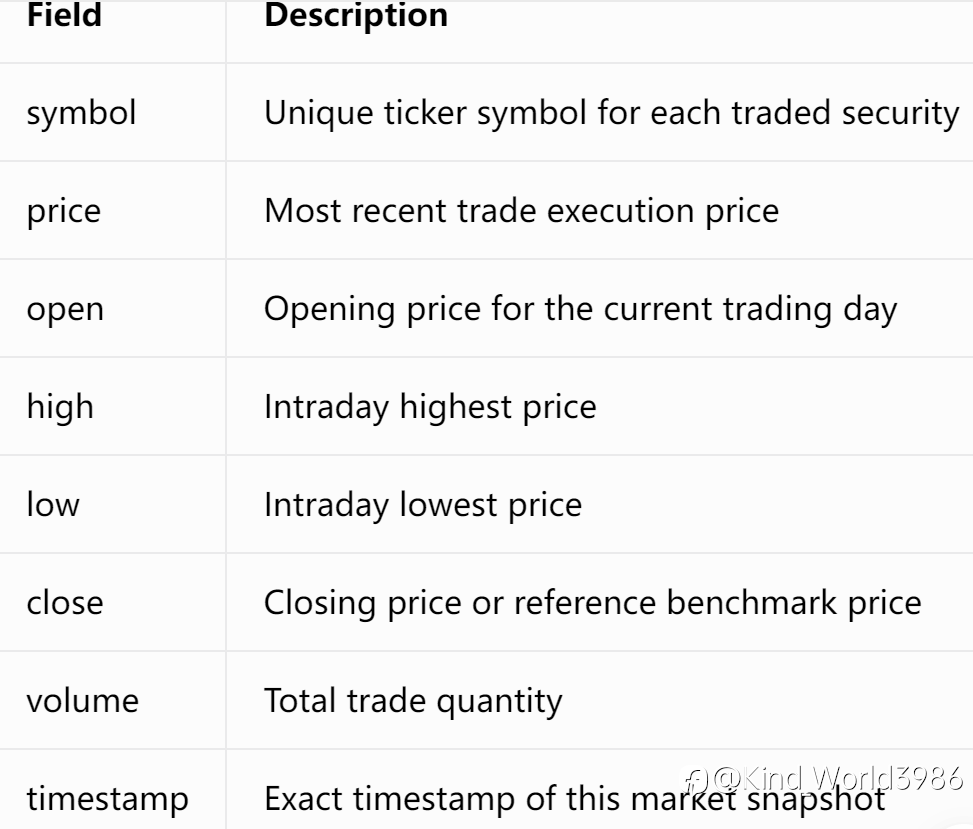
Practical note: timestamp is frequently underestimated. Even when price values look correct, aggregated minute‑bars or time‑series charts can suffer misaligned time axes. This creates subtle time‑mismatch bias that distorts back‑test results.Best practice: Keep the original raw timestamp returned by the API. Perform format conversion only in business logic. This prevents time‑series misalignment across live monitoring, historical playback, and back‑test dataset reuse.
Time‑Series & Candle‑Bar Construction: Preserve Tick‑Data Integrity
The core fields above are sufficient for simple static price viewing. Building live time‑series charts or archiving tick‑level data for backtesting requires continuous tick‑by‑tick ingestion, with strict requirements for time continuity and data completeness.
Sample raw tick payload:
{
  "symbol": "AAPL",
  "price": "185.25",
  "volume": "300",
  "timestamp": "2026-08-07 09:35:12"
}
The price value alone only tells you the execution level. Combined with volume, you can observe real‑time market activity at that moment, which is valuable for volume‑price strategy analysis and sample collection.
Most minute‑resolution candles are not directly provided by market APIs. They are generated locally by aggregating raw tick streams. Price, volume and timestamp all participate in aggregation logic. Any corrupted field will distort dashboard charts and pollute back‑testing datasets, leading to misleading strategy evaluation outcomes.
Order‑Book Data: Researching Liquidity and Short‑Term Market Dynamics
Basic price monitoring does not require order‑book information. If you want to study short‑term liquidity and order‑driven market behaviour, these fields deliver meaningful research signals:
- bid price: Buyer’s quoted price
- ask price: Seller’s quoted price
- bid volume: Total quantity of resting buy orders
- ask volume: Total quantity of resting sell orders
Changes in bid‑ask spread reflect short‑term liquidity conditions. Shifts in resting‑order volumes offer supplementary context for market state analysis and can support exploratory short‑term factor research.
Important reminder: Order‑book metrics are for observation and quantitative research only. They should not be used as standalone trading signals and require multi‑dimensional factor validation.
Time‑Zone Handling: A Common Hidden Pitfall for US Stock Data
Time‑zone conversion issues create subtle bugs that impact both live dashboards and back‑test reliability. I once encountered full time‑axis offset in time‑series charts. The raw API responses were valid, but hard‑coded hour offsets in my code ignored EDT / EST daylight‑saving transitions. This caused incorrect timestamps for parts of the trading session and broke sample matching in backtesting.
Three practical engineering rules I follow:
- Normalize all market timestamps to a universal standard‑time baseline.
- Convert timestamps to Eastern Time or other target time zones only at the rendering layer.
- Never implement timezone logic with simple manual hour addition or subtraction; offset rules vary across trading days.
WebSocket Real‑Time Subscription Example
For quantitative monitoring, repeated HTTP polling brings high latency and risks losing high‑frequency tick events. WebSocket long‑lived connections are preferred for real‑time market‑data ingestion. Below is a Python snippet for subscribing to trade events using AllTick API, suitable for raw tick‑data collection:
import websocket
import json

def on_message(ws, message):
    data = json.loads(message)

    symbol = data.get("symbol")
    price = data.get("price")
    volume = data.get("volume")
    timestamp = data.get("timestamp")

    print(
        f"{symbol} price:{price} volume:{volume} time:{timestamp}"
    )

def on_open(ws):
    request = {
        "action": "subscribe",
        "symbol": "AAPL",
        "type": "trade"
    }
    ws.send(json.dumps(request))

ws = websocket.WebSocketApp(
    "wss://api.alltick.co/stock/websock...",
    on_open=on_open,
    on_message=on_message
)

ws.run_forever()
After receiving real‑time data, you can write records to cache and persistent storage. The data feeds power live dashboard visuals while building tick archives for later backtesting and factor research.
Final Thoughts: Align Field Selection With Your Research Goals
When building real‑time dashboards or quantitative data pipelines, avoid blindly storing every field returned by your market API. Extra fields increase complexity for parsing, validation and storage, and raise preprocessing overhead for data cleaning and back‑test preparation.
My practical workflow: define your research and tooling objectives first, then decide which datasets you actually need:
- Basic price monitoring: use core market fields
- Candle‑bar generation & back‑test dataset building: prioritize complete trade records and timestamps
- Order‑book and liquidity‑factor research: focus on bid‑ask prices and resting‑order volumes
The real challenge of working with US‑stock market APIs is not just fetching data, but building stable, reusable time‑series datasets that support both live monitoring and back‑testing. Thoughtful field‑selection simplifies chart rendering, analytics and dataset iteration. For quant projects, sources such as AllTick API can reduce heavy low‑level market‑data ingestion work, letting you focus more on strategy research and data‑processing logic.
Have you run into back‑testing bias caused by timestamp errors or tick‑aggregation bugs when working with US equity data? Feel free to share your experience in the comments.
إخلاء المسؤولية: الآراء الواردة هنا تعبر فقط عن رأي الكاتب، ولا تمثل الموقف الرسمي لـ Followme. لا تتحمل Followme مسؤولية دقة أو اكتمال أو موثوقية المعلومات المُقدمة، ولا تتحمل مسؤولية أي إجراءات تُتخذ بناءً على المحتوى، ما لم يُنص على ذلك صراحةً كتابيًا.

