


Vistra Corp., (VST) operates as an integrated retail electricity & power generation company in the United States. It operates through five segments like Retail, Texas, East, West & Asset Closure. It comes under Utilities sector & trades as “VST” ticker at NYSE.
In daily, VST ended April rally in ((1)) at $219.82 high & favors pullback in ((2)) correction. We like to buy the next pullback in extreme area in ((2)) against 4.07.2025 low.
In Daily, it placed (I) at $199.84 high in January-2025 & (II) at $90.51 low in March-2025 low. Above there, it favors rally in I of (III) as it broke above January-2025 low. Within (I), it placed I at $107.24 high, II at $66.50 low, III at $168.67 high, IV at $131.64 low & V at $199.84 high. Below there, it placed a of (II) at $132.59 low, b at $176.49 high & c at $90.51 low to end (II). Above April-2025 low, it ended (1) of ((1)) at $120.96 high, (2) at $103.34 low, (3) at $216.85 high, (4) at $184.61 low & (5) at $219.82 high.
VST - Elliott Wave Latest Daily View: 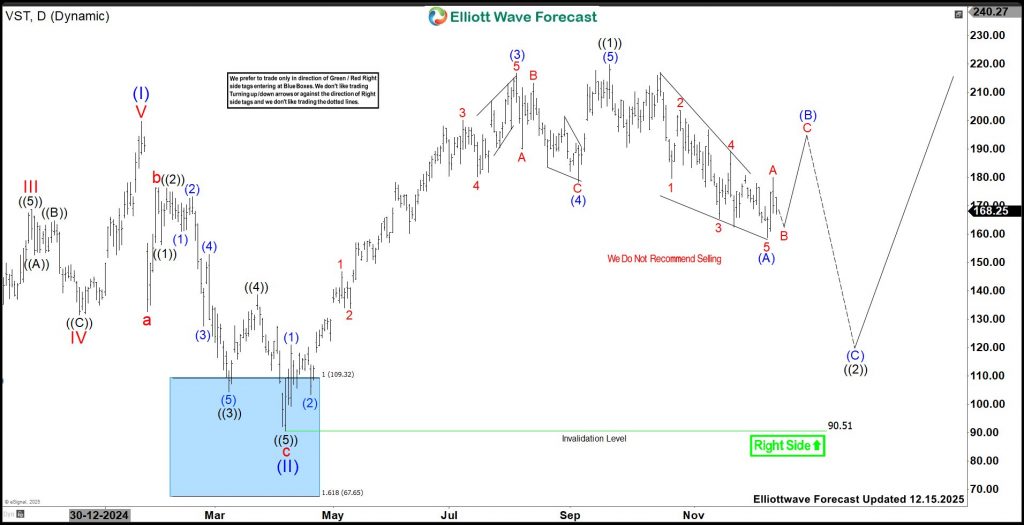
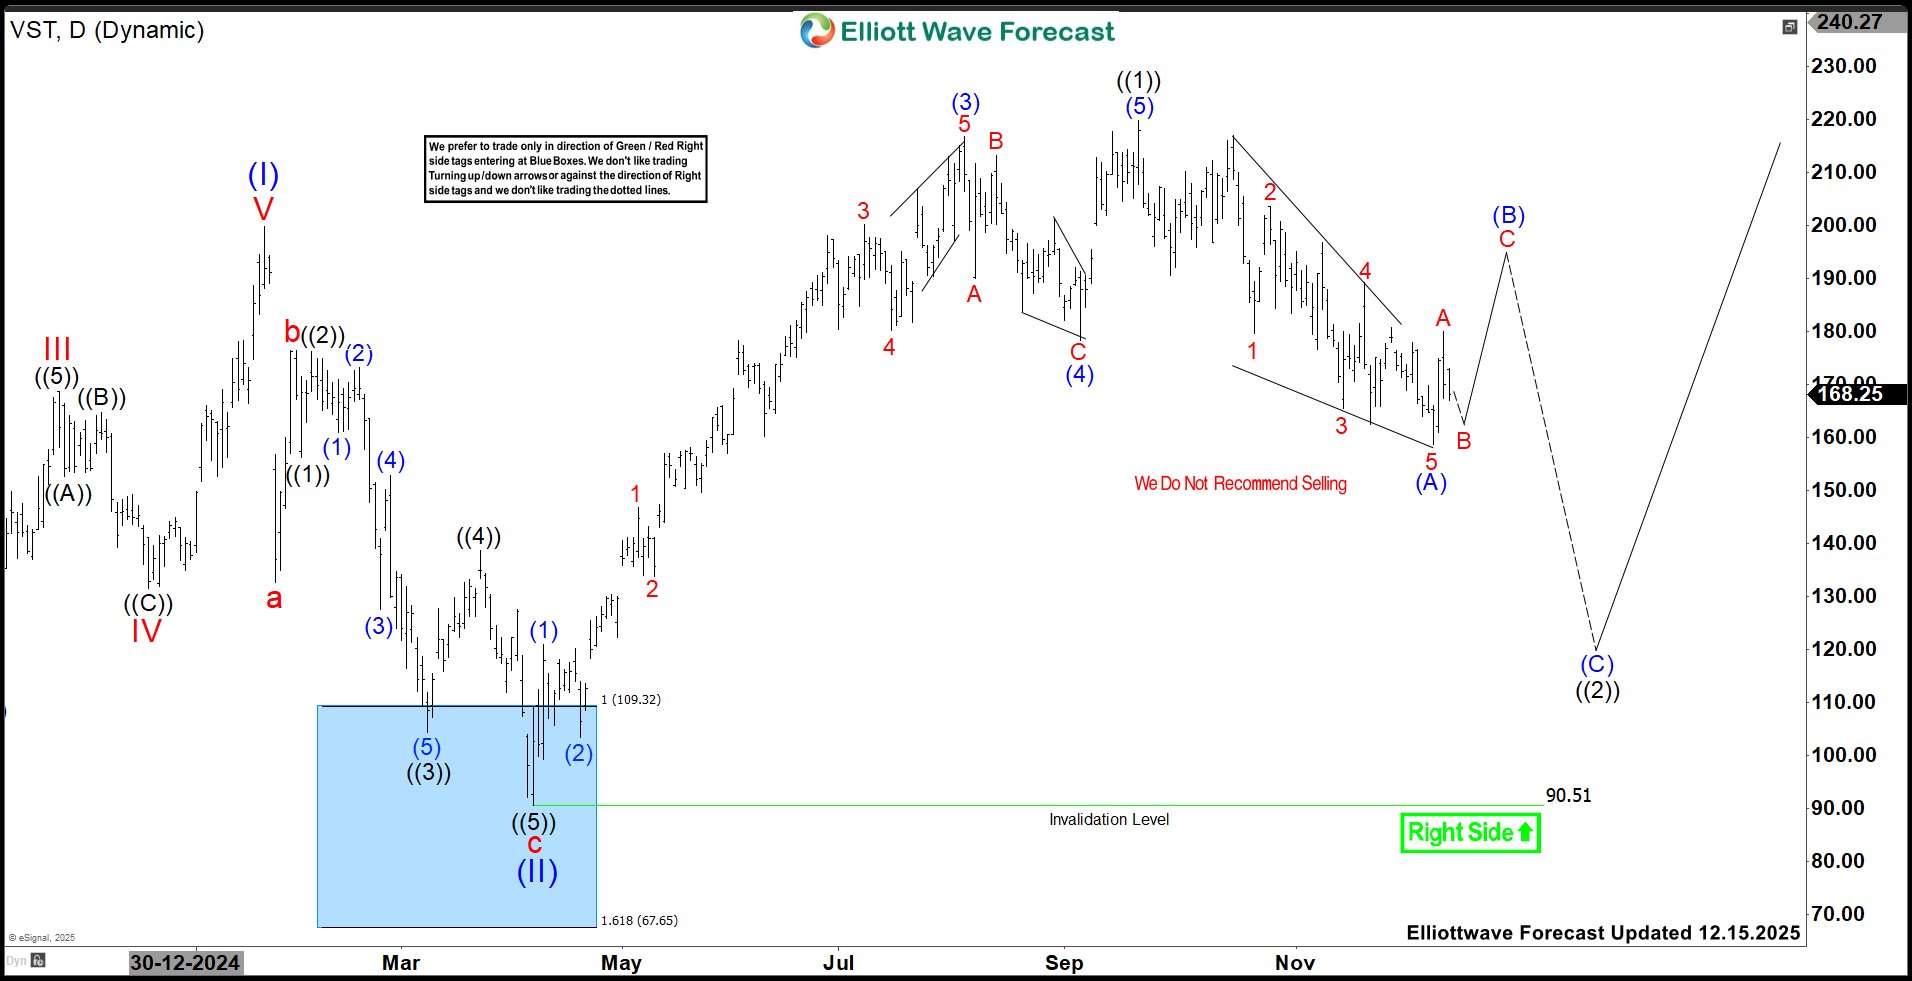
Below ((1)) high, it placed (A) at $158.65 low in proposed diagonal. It favors bounce in (B) in 3, 7 or 11 swings into $182.42 - $196.95 area to correct against 9.22.2025 high. Within (A), it ended 1 at $179.65 low, 2 at $203.66 high, 3 at 165.58 low, 4 at $189.29 high & 5 at $158.65 low. Currently, it favors pullback in B of (B), while ended A at $180 high. The current pullback should hold above $158.65 low to extend higher in C of (B). If it makes a new low, then it can be the part of (A) before expecting a bounce in (B). Once it ends (B) connector in 3 or 7 swings, it should extend lower in (C) against April-2025 low. We like to buy the extreme area in ((2)) pullback for ((3)) rally or at least 3 swing bounce.
إخلاء المسؤولية: الآراء الواردة هنا تعبر فقط عن رأي الكاتب، ولا تمثل الموقف الرسمي لـ Followme. لا تتحمل Followme مسؤولية دقة أو اكتمال أو موثوقية المعلومات المُقدمة، ولا تتحمل مسؤولية أي إجراءات تُتخذ بناءً على المحتوى، ما لم يُنص على ذلك صراحةً كتابيًا.

