


Hello everyone. In today’s article, we will look at the past performance of the 1 Hour Elliott Wave chart of Netflix Inc. ($NFLX). The rally from 1.17.2024 low at $476.01 unfolded as 5 waves impulse. So, we expected the pullback to unfold in 7 swings and find buyers again. We will explain the structure & forecast below:
Double Three (WXY) Corrective Structure
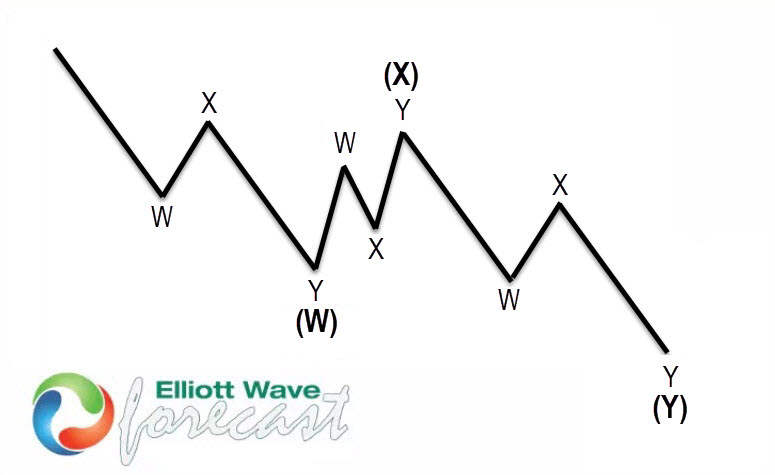
$NFLX 1H Elliott Wave Chart 2.06.2024:
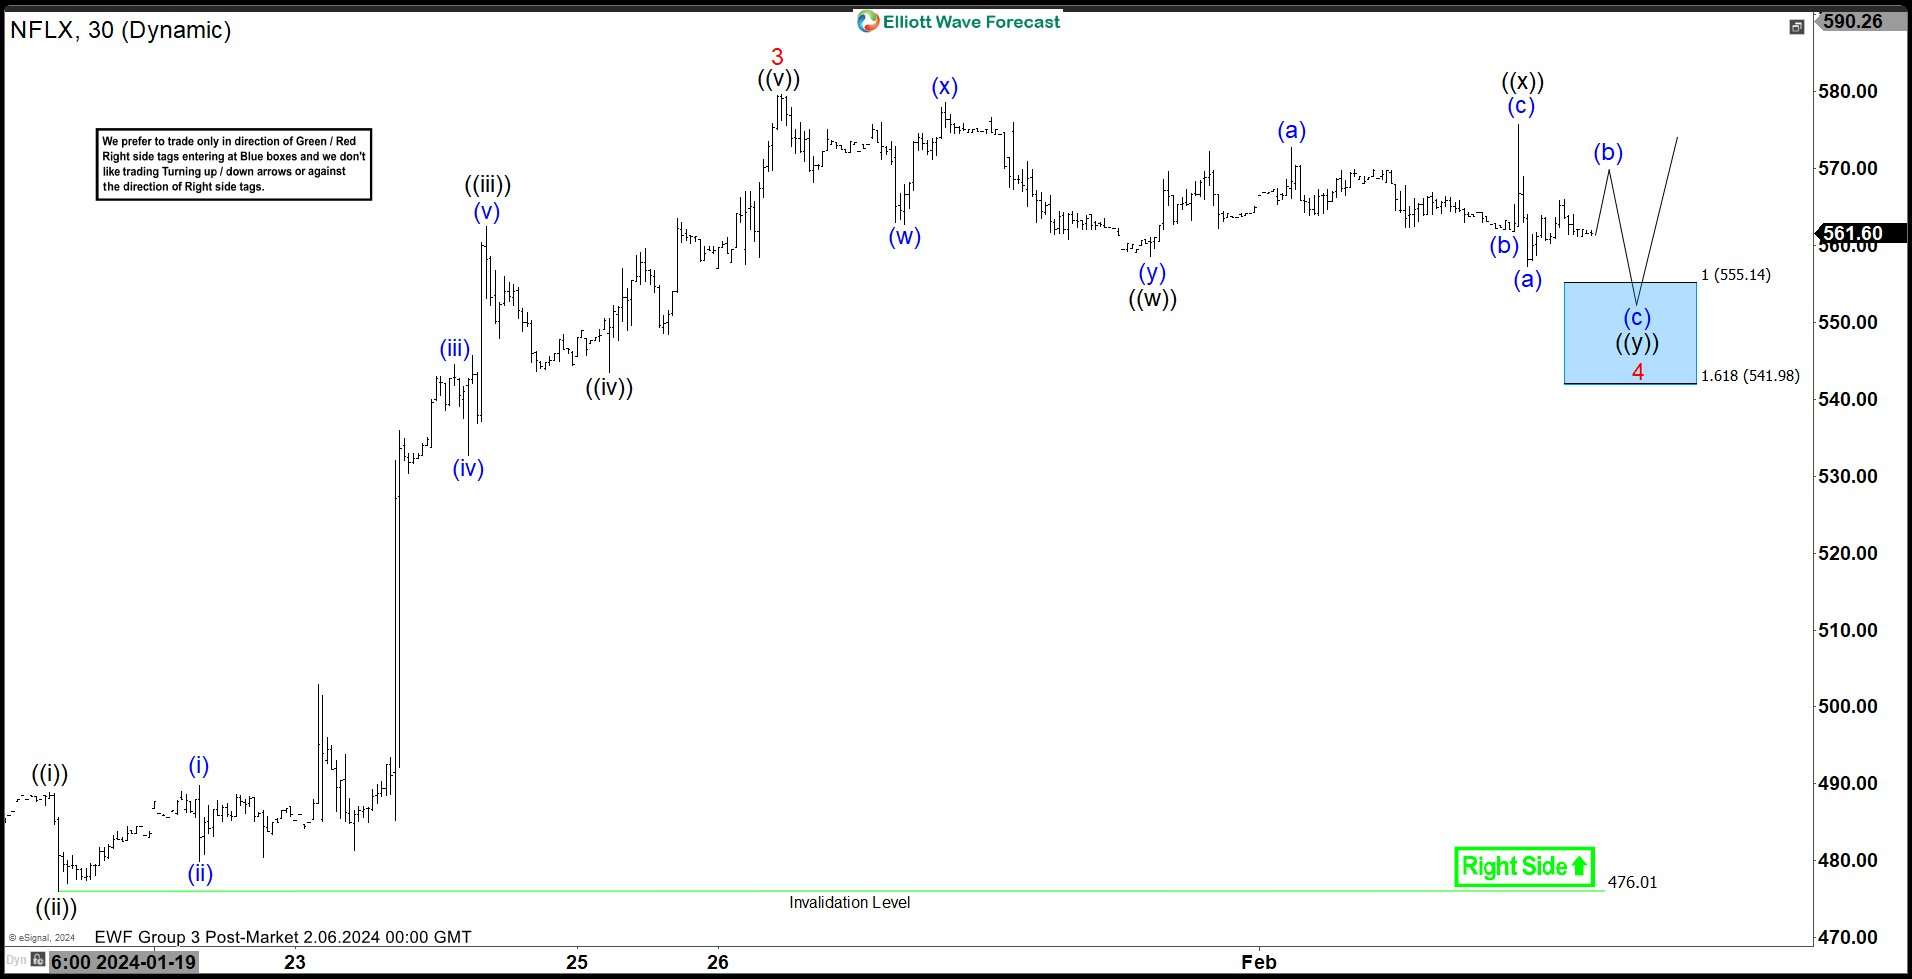 Here is the 1H Elliott Wave count from 2.06.2024. We expected the pullback to find buyers at the blue box area at 555.14 – 541.98 in a 7 swing structure (WXY).
$NFLX 1H Elliott Wave Chart 2.11.2024:
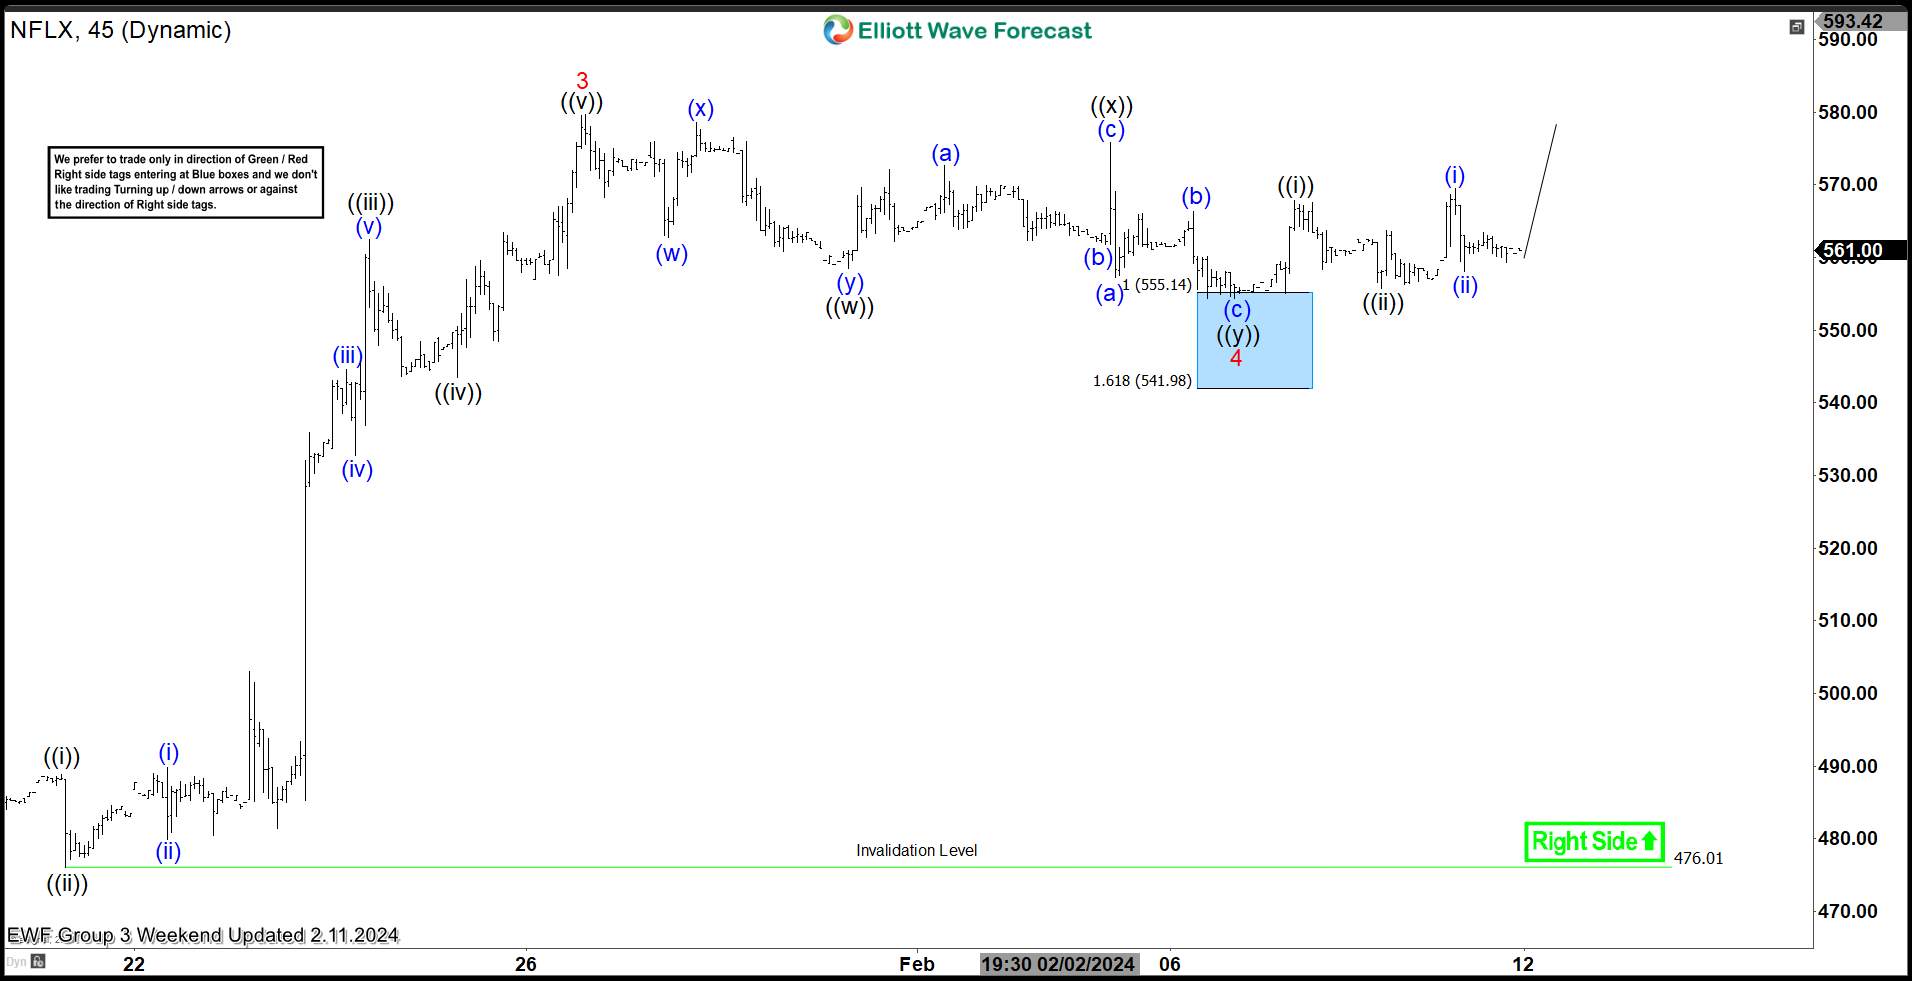 Here is the 1H update few days later from 2.11.2024 showing the bounce taking place as expected. The stock reacted higher from the blue box after doing a Double Three correction allowing longs to get a risk free position. The stock is expected to remain supported towards $588 – 600 before another pullback can happen.
إخلاء المسؤولية: الآراء الواردة هنا تعبر فقط عن رأي الكاتب، ولا تمثل الموقف الرسمي لـ Followme. لا تتحمل Followme مسؤولية دقة أو اكتمال أو موثوقية المعلومات المُقدمة، ولا تتحمل مسؤولية أي إجراءات تُتخذ بناءً على المحتوى، ما لم يُنص على ذلك صراحةً كتابيًا.

اترك رسالتك الآن