3M Company (NYSE: MMM) is a globally recognized leader in innovation, manufacturing, and technology solutions. With a rich history spanning over a century, 3M has established itself as a trusted name in various industries. In this article, we will explore the Elliott Wave technical chart to provide an overview for long-term Prospects and potential opportunities that lie ahead for 3M.
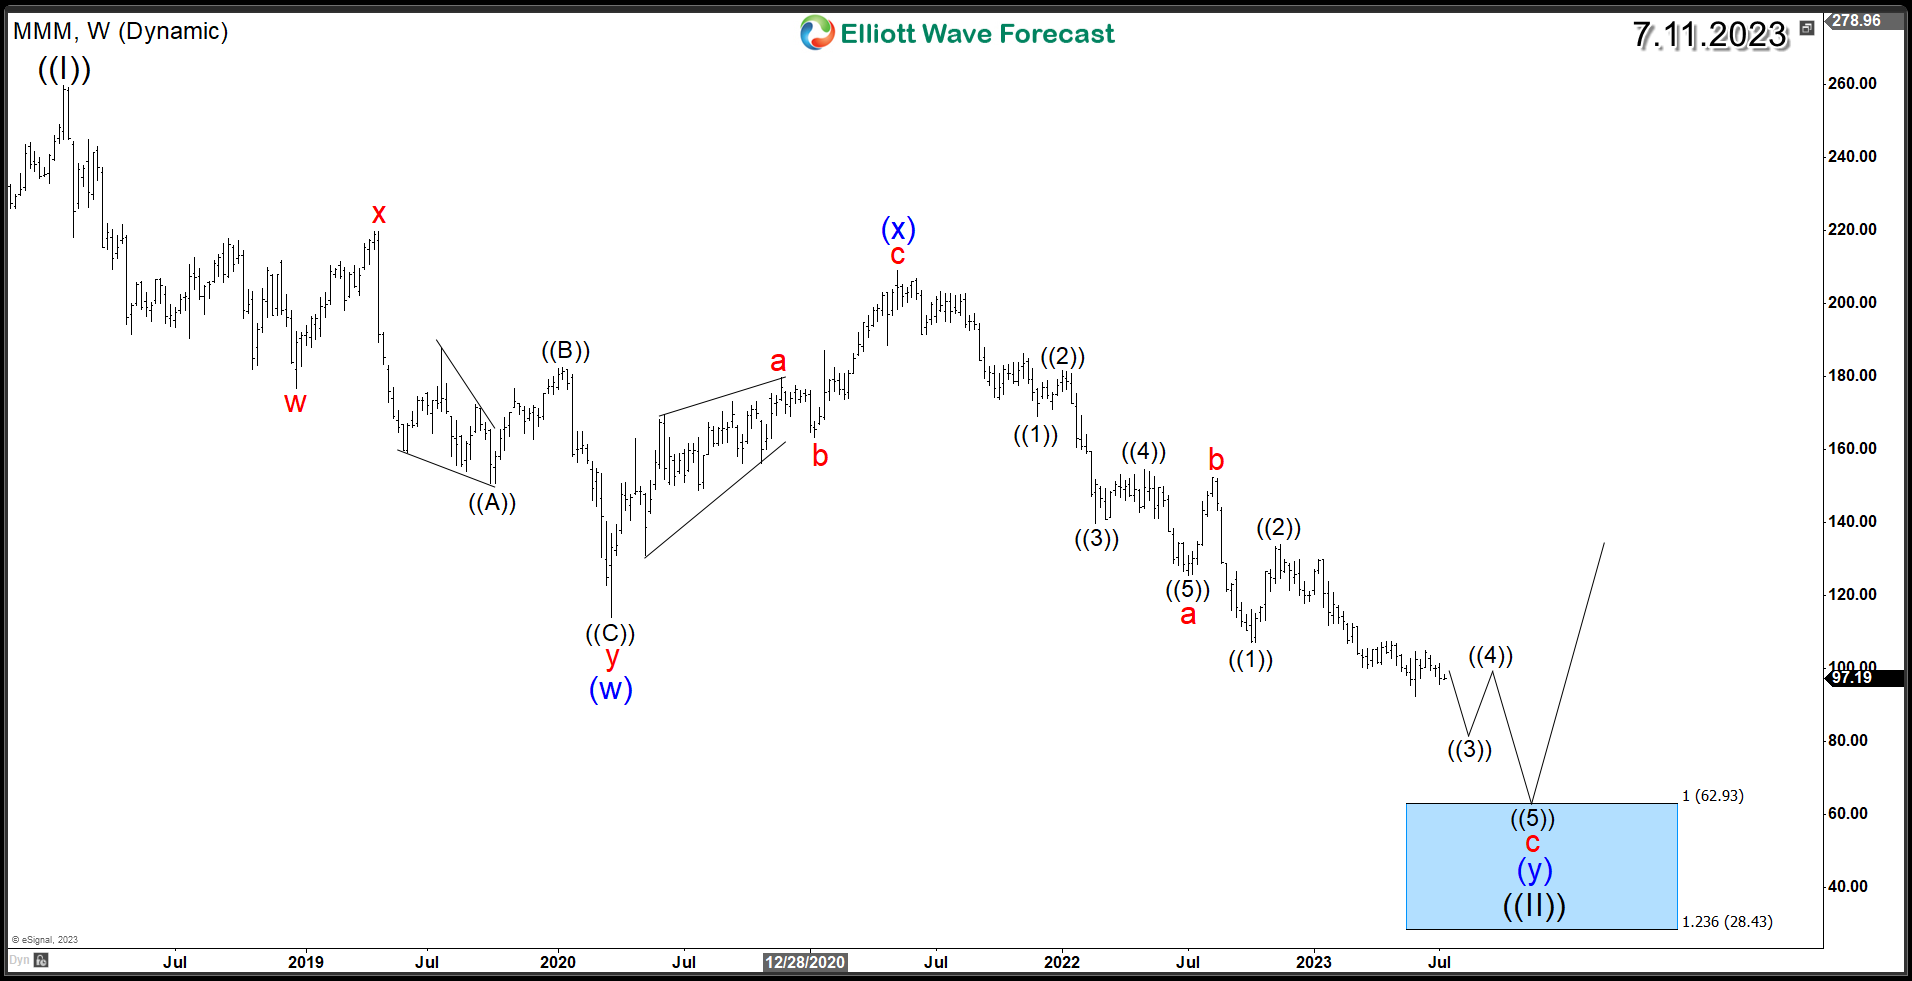
3M is down more than 60% since it's all time high at $259 and it's correcting the grand super cycle. The downtrend that started from January 2018 peak is unfolding as an Elliott Wave Double Three corrective structure which consist of 7 swings. The initial 3 swing of (w) ended in 2020 followed by a connector in wave (x) which market the peak of 2021 similar to the rest of the stock market. Down from there, another 3 swings is taking place aiming for the equal legs area at $62 - $28.
The mentioned area will present the extreme blue box within the weekly cycle, which is a High-frequency area where market is likely to end cycles and make a turn. The stock is expected to bounce higher from there at least in a larger 3 waves to correct the previous decline. Furthermore, if the upward reaction transforms into a strong and impulsive five-wave advance, it has the potential to initiate a new bullish cycle to the upside.
In summary, 3M Company is currently in the final phase of a corrective structure, indicating a potential major bottom on the horizon. As the stock enters the next decline, investors may find a compelling long-term investment opportunity for the years ahead.
3M Weekly Chart
إخلاء المسؤولية: الآراء الواردة هنا تعبر فقط عن رأي الكاتب، ولا تمثل الموقف الرسمي لـ Followme. لا تتحمل Followme مسؤولية دقة أو اكتمال أو موثوقية المعلومات المُقدمة، ولا تتحمل مسؤولية أي إجراءات تُتخذ بناءً على المحتوى، ما لم يُنص على ذلك صراحةً كتابيًا.

اترك رسالتك الآن