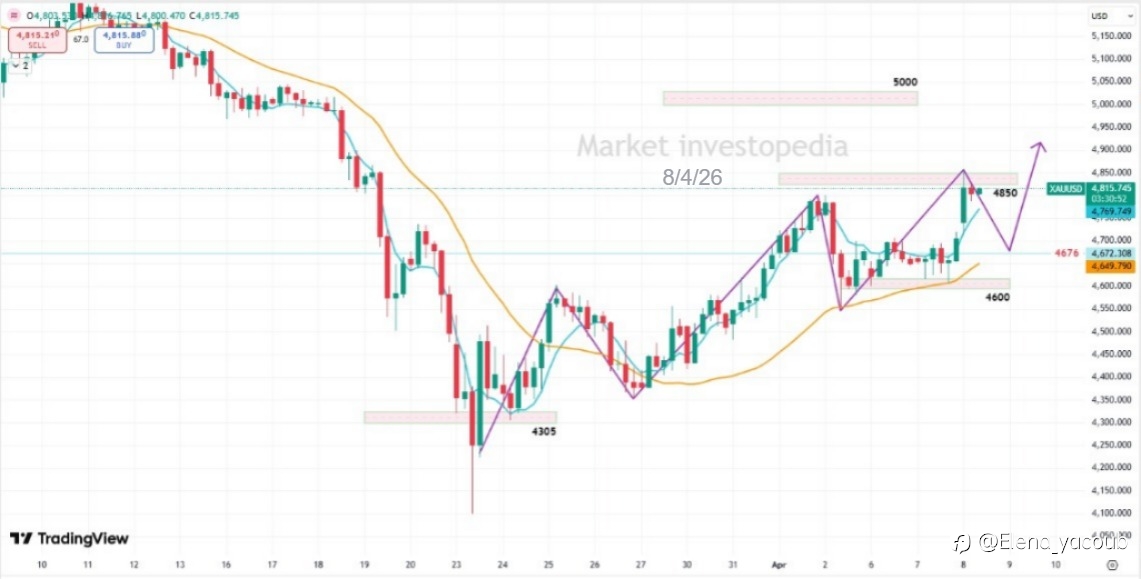
** 🟡 Gold Analysis (4H Chart)*
🔹 Gold is showing **bullish momentum** with higher highs and higher lows.
🔹 Price is testing **4850 resistance**, facing short-term selling pressure.
🔹 A small pullback is possible before attempting a **break above 4850**.
🔹 **12 EMA above 52 EMA** keeps the overall trend bullish. 📈
💡 Bias: Buy on dips / breakout confirmation
إخلاء المسؤولية: الآراء الواردة هنا تعبر فقط عن رأي الكاتب، ولا تمثل الموقف الرسمي لـ Followme. لا تتحمل Followme مسؤولية دقة أو اكتمال أو موثوقية المعلومات المُقدمة، ولا تتحمل مسؤولية أي إجراءات تُتخذ بناءً على المحتوى، ما لم يُنص على ذلك صراحةً كتابيًا.

اترك رسالتك الآن