


Gold Technical Analysis (4H Chart)
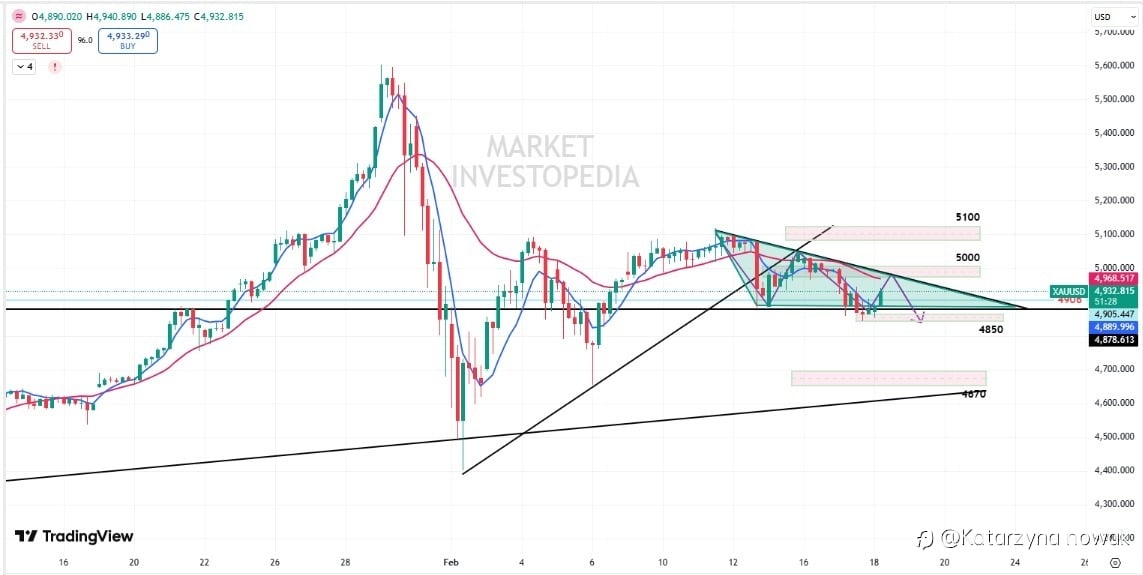
Gold’s broader trend remains bullish; however, on the 4-hour timeframe, price action is developing within a descending triangle pattern, indicating potential short-term consolidation or corrective pressure.
Prices are currently holding above the pivot level at 4906 and attempting to test the upper trendline of the formation. A temporary pullback from this region remains possible.
A decisive break below the immediate support at 4850 (S1) could accelerate short-term bearish momentum, potentially exposing S2 at 4670.
#XAU/USD# #gold# #CrazyGold# #GOLDTODAY# #trading#
إخلاء المسؤولية: الآراء الواردة هنا تعبر فقط عن رأي الكاتب، ولا تمثل الموقف الرسمي لـ Followme. لا تتحمل Followme مسؤولية دقة أو اكتمال أو موثوقية المعلومات المُقدمة، ولا تتحمل مسؤولية أي إجراءات تُتخذ بناءً على المحتوى، ما لم يُنص على ذلك صراحةً كتابيًا.

