


Analysis -
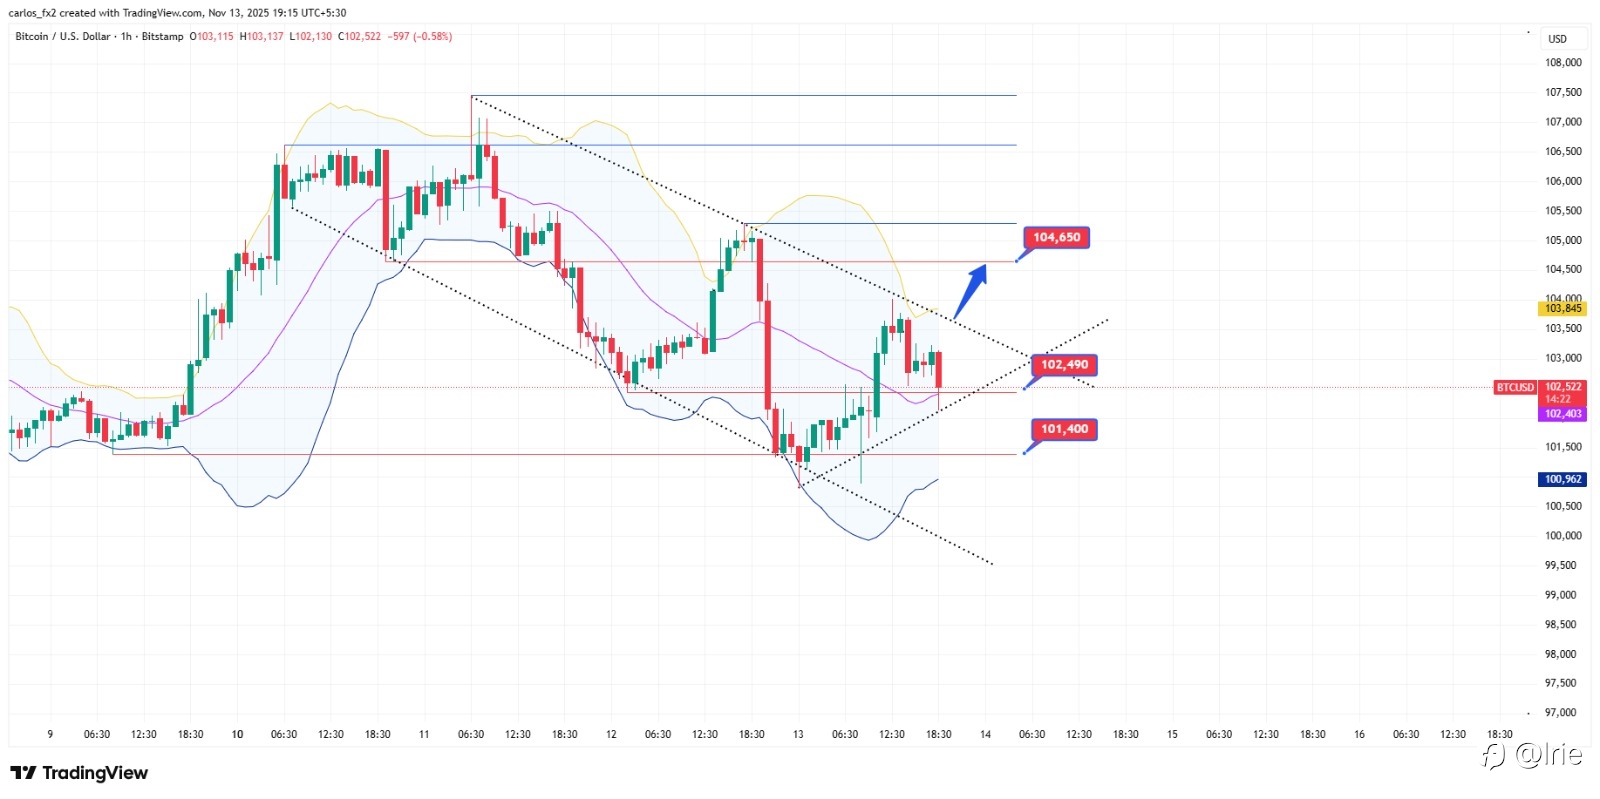
Bitcoin (BTCUSD) is currently trading near the $102,500 mark, moving within a descending channel structure while showing early signs of a possible breakout attempt. The price recently rebounded from the $101,400 support region and is testing the $102,490 mid-level resistance. The Bollinger Bands indicate moderate volatility, with the price holding above the lower band — suggesting a potential near-term recovery if momentum builds.
Outlook -
• On the Upside :
A break and close above $102,490 could open the path toward $104,650, aligning with the upper boundary of the descending channel and the next significant resistance zone. Sustained bullish momentum beyond $104,650 could trigger a further push toward the $106,000–$107,000 area.
• On the Downside :
If BTC fails to hold above $102,000, renewed selling pressure may drag it back toward $101,400, with further downside risk toward the $100,962 support base. A breakdown below this zone could invalidate short-term bullish momentum and expose $100,000 psychological support.
Trend -
The short-term trend remains neutral-to-bearish within the descending channel. However, price action near $102,000–$101,400 shows a base-building pattern. A confirmed breakout above $102,490–$104,650 would shift momentum back to the bullish side.
Strategy -
• Bullish Setup: Consider buying on dips near $101,400–$101,000, targeting $102,490 initially and $104,650 on breakout confirmation.
• Bearish Setup: A close below $101,400 could invite short opportunities toward $100,962 and $100,000, with tight risk management.
Key Levels -
• Resistance (R2): $104,650
• Resistance (R1): $102,490
• Support (S1): $101,400
• Support (S2): $100,962
• Psychological Level: $100,000
إخلاء المسؤولية: الآراء الواردة هنا تعبر فقط عن رأي الكاتب، ولا تمثل الموقف الرسمي لـ Followme. لا تتحمل Followme مسؤولية دقة أو اكتمال أو موثوقية المعلومات المُقدمة، ولا تتحمل مسؤولية أي إجراءات تُتخذ بناءً على المحتوى، ما لم يُنص على ذلك صراحةً كتابيًا.
