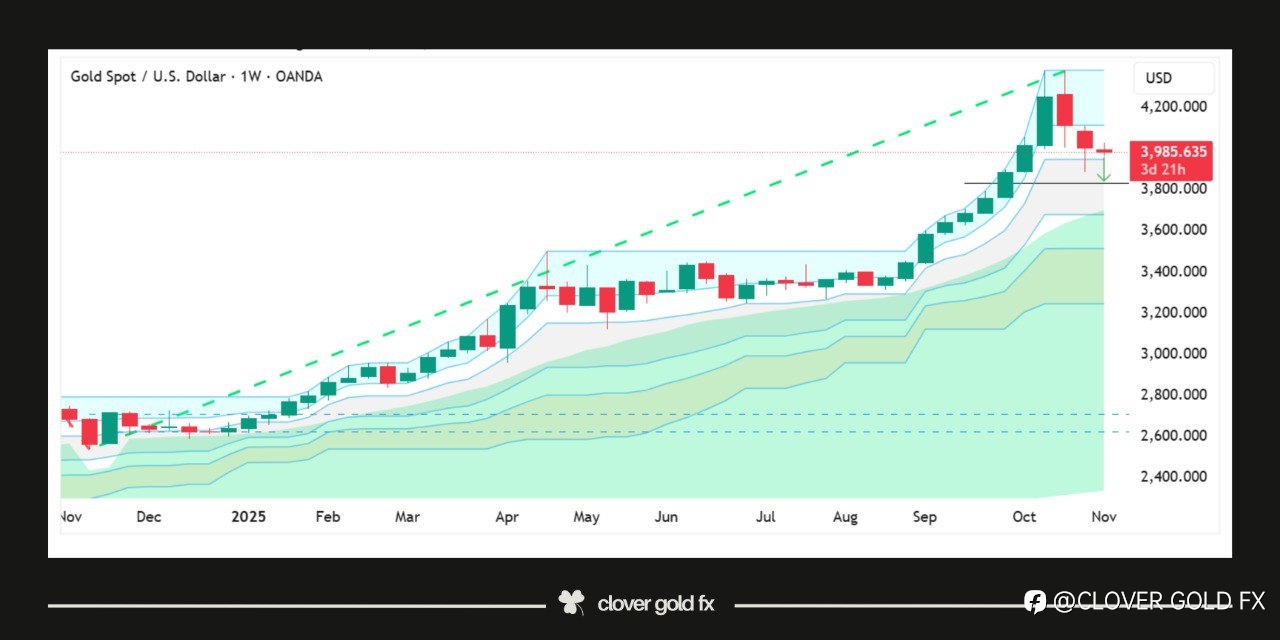
After completing a strong nine-week bullish sequence on the weekly chart, XAUUSD appears to be entering a corrective phase that mirrors previous market behavior seen after extended impulsive rallies. Historically, such prolonged bullish runs often trigger profit-taking and short-term reversals as momentum fades and institutional traders rebalance positions. The current structure shows signs of exhaustion at the top, with a shift from large impulsive candles to smaller corrective ones, suggesting reduced buying pressure. If history repeats, gold may retrace toward the 50% Fibonacci zone, a level that often acts as a natural equilibrium between buyers and sellers before the broader trend resumes. This area also aligns with prior consolidation zones, making it a potential demand region where new accumulation could begin if the long-term uptrend remains intact.
إخلاء المسؤولية: الآراء الواردة هنا تعبر فقط عن رأي الكاتب، ولا تمثل الموقف الرسمي لـ Followme. لا تتحمل Followme مسؤولية دقة أو اكتمال أو موثوقية المعلومات المُقدمة، ولا تتحمل مسؤولية أي إجراءات تُتخذ بناءً على المحتوى، ما لم يُنص على ذلك صراحةً كتابيًا.

اترك رسالتك الآن