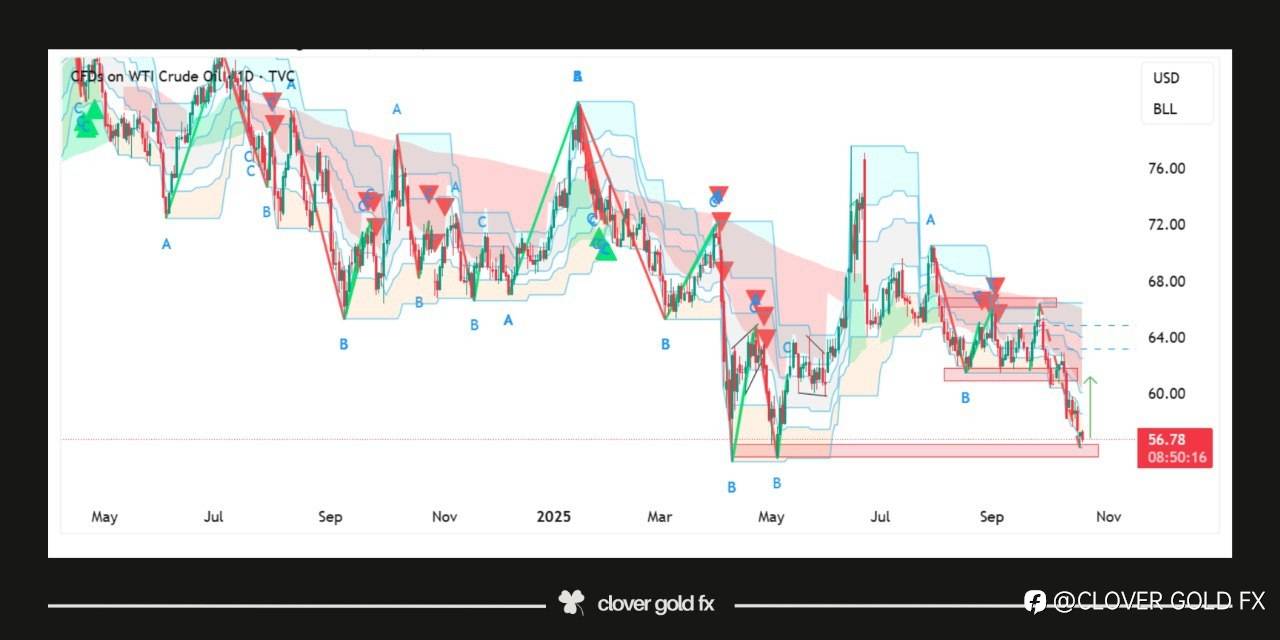
#usoil
The daily chart of US Oil shows a clear technical structure indicating potential bullish momentum ahead. After an extended downtrend the market has formed a triple bottom pattern which often signals exhaustion of selling pressure and a possible reversal. The appearance of a bullish hammer at this key support zone further strengthens the idea that buyers are stepping in to defend the area. Following the earlier range breakout and rejection from horizontal resistance the price has now returned to a major demand region where previous reactions have occurred. This combination of patterns suggests that the market could soon experience upward movement as sentiment shifts from bearish to bullish with traders watching closely for confirmation of continued strength in the coming sessions.
إخلاء المسؤولية: الآراء الواردة هنا تعبر فقط عن رأي الكاتب، ولا تمثل الموقف الرسمي لـ Followme. لا تتحمل Followme مسؤولية دقة أو اكتمال أو موثوقية المعلومات المُقدمة، ولا تتحمل مسؤولية أي إجراءات تُتخذ بناءً على المحتوى، ما لم يُنص على ذلك صراحةً كتابيًا.

اترك رسالتك الآن