


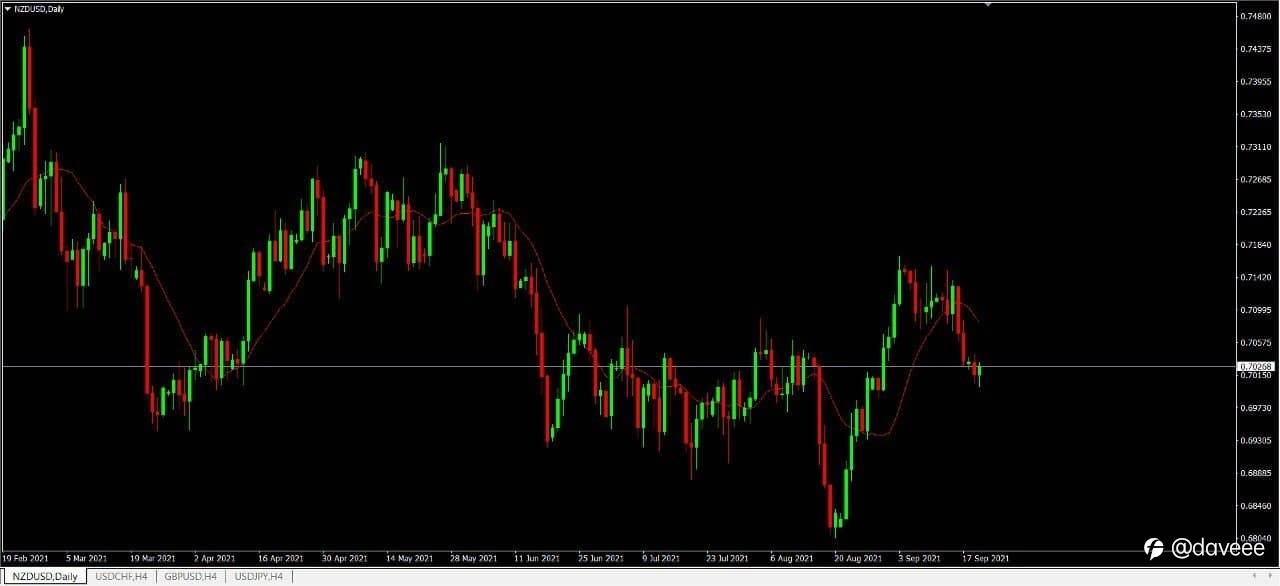
NZD/USD DAILY CHART ANALYSIS
Always keep track that a head-and-shoulders position materialized in the first quarter of 2021 as NZD/USD slipped below the 50-Day SMA (0.7006) this is the first time this has happened since November, with the exchange rate pushing below the 200-Day SMA (0.7116) for the first time since June 2020 to trade to a fresh yearly low (0.6805) in August.
Although, NZD/USD reversed course ahead of the November 2020 low (0.6589) among the failed attempt to close below the 0.6810 (38.2% expansion) region, with a bull flag formation taking shape earlier this month as the exchange rate cleared the July high (0.7105).
☎️ Telegram : https://t.me/MU_I09
📧 Email: [email protected]
#cpt #cptinternational #gold #forex #crudeoil #currency #investment #stock #mt4 #tradingapp #trading #technicalanalysis #USD #NZD @CPT International
إخلاء المسؤولية: الآراء الواردة هنا تعبر فقط عن رأي الكاتب، ولا تمثل الموقف الرسمي لـ Followme. لا تتحمل Followme مسؤولية دقة أو اكتمال أو موثوقية المعلومات المُقدمة، ولا تتحمل مسؤولية أي إجراءات تُتخذ بناءً على المحتوى، ما لم يُنص على ذلك صراحةً كتابيًا.

اترك رسالتك الآن