
EURUSD Wyckoff Distribution Schematic
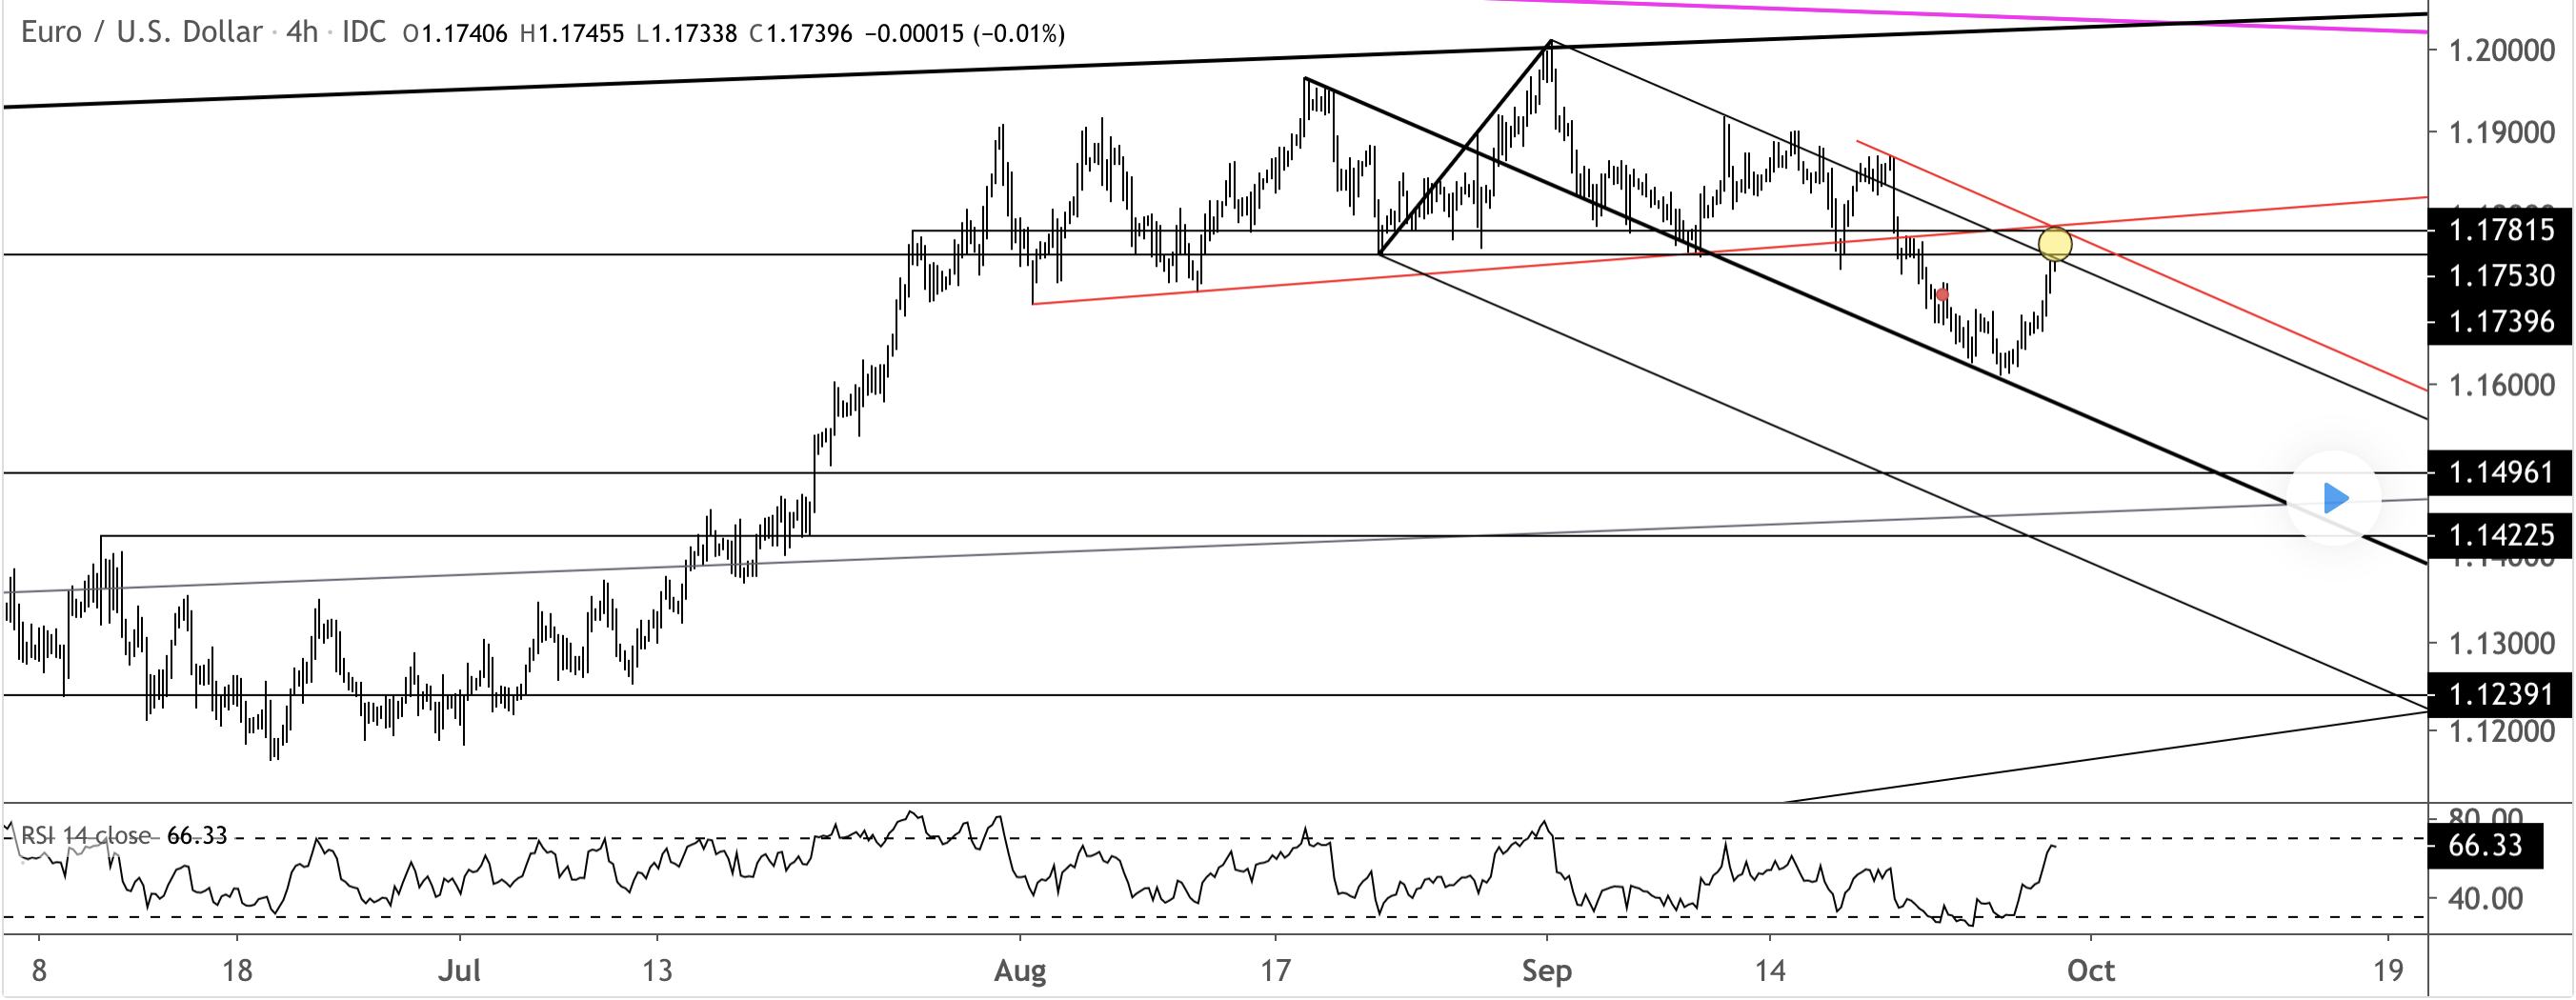
We last looked at the Wyckoff Distribution Schematic on 9/14. To review:
I’m showing a Euro futures chart because volume must be incorporated when analyzing a market from a Wyckoff perspective. Volume on SOW (sign of weakness) days are highlighted with yellow circles. Notice how volume expanded into the BC (buying climax) and decreased on the ST (secondary test). A drop below 1.1750 is required in order to complete the distribution.
#EUR/USD#
إخلاء المسؤولية: الآراء الواردة هنا تعبر فقط عن رأي الكاتب، ولا تمثل الموقف الرسمي لـ Followme. لا تتحمل Followme مسؤولية دقة أو اكتمال أو موثوقية المعلومات المُقدمة، ولا تتحمل مسؤولية أي إجراءات تُتخذ بناءً على المحتوى، ما لم يُنص على ذلك صراحةً كتابيًا.