


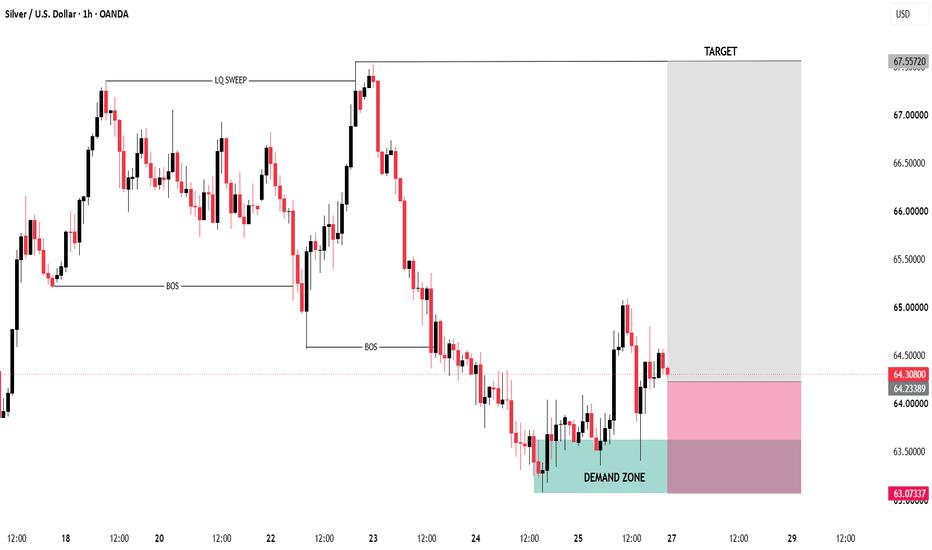
Silver is showing a clear bearish structure from the 67.50 area, with multiple lower highs and lower lows. However, the recent price action suggests a potential short-term structural recovery.
🔹 Price swept the previous liquidity around 67.30–67.50 before a strong bearish displacement.
🔹 The decline created successive BOS levels, confirming the prevailing bearish structure.
🔹 Price eventually reached the 63.30–63.60 demand zone, where selling pressure started to weaken.
🔹 From this zone, price produced a strong bullish reaction and pushed back toward 64.50–65.00.
🔹 Current price is consolidating around 64.30–64.50, so the reaction from the marked demand zone is the key area to observe.
🔹 A sustained break and close above the recent local high could strengthen the short-term bullish structure.
🔹 If the demand zone fails, the recent bullish recovery would be weakened and the broader bearish structure could regain control.
Key levels:
🟢 Demand: 63.30–63.60
⚪ Current structure: 64.30–64.50
🔺 Resistance / recent swing: 64.90–65.10
🔺 Major liquidity area: 67.30–67.50
📌 Educational focus: Liquidity sweep → displacement → BOS → demand-zone reaction → structure confirmation
إخلاء المسؤولية: الآراء الواردة هنا تعبر فقط عن رأي الكاتب، ولا تمثل الموقف الرسمي لـ Followme. لا تتحمل Followme مسؤولية دقة أو اكتمال أو موثوقية المعلومات المُقدمة، ولا تتحمل مسؤولية أي إجراءات تُتخذ بناءً على المحتوى، ما لم يُنص على ذلك صراحةً كتابيًا.

