


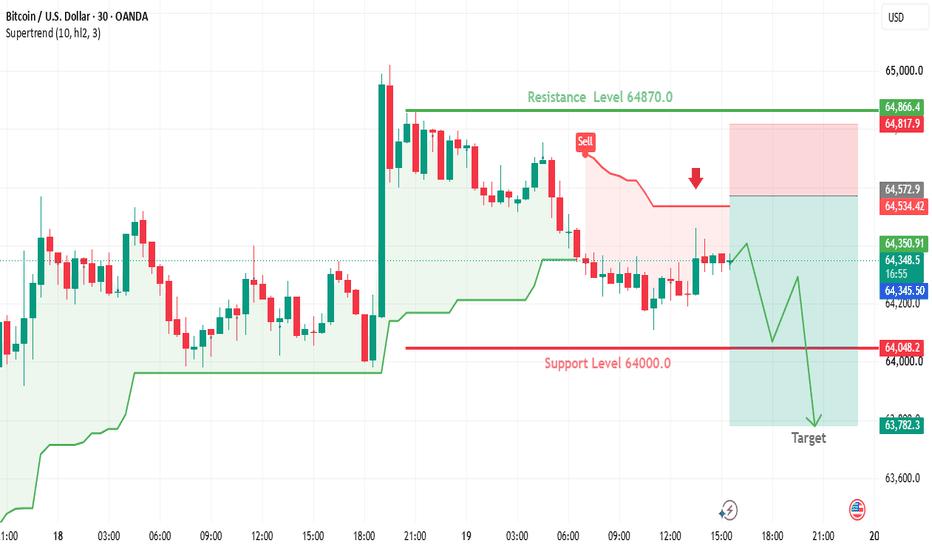
Chart Analysis (30-Minute Time Frame)
The chart shows Bitcoin (BTC/USD) trading around $64,361, with the market moving inside a short-term consolidation phase after failing to maintain momentum above the recent highs.
Key Technical Levels
Resistance: $64,870
Sell Zone: $64,572
Support: $64,000
Bearish Target: $63,782
Bearish Signals
The chart highlights a sell setup near $64,572, suggesting that sellers are defending this area.
Bitcoin failed to retest the $64,870 resistance level, indicating weakening bullish momentum.
The Supertrend indicator remains above the current market price, reinforcing the bearish outlook.
Recent candles show a series of lower highs, which often signals increasing selling pressure.
Trading Scenario
If BTC remains below $64,572, the bearish scenario could continue.
Rejection from the sell zone may push the price toward $64,000.
A breakdown below $64,000 could accelerate selling.
The next projected target is $63,782.
Invalidation Scenario
A sustained move above $64,870 would invalidate this bearish setup and could shift momentum back in favor of buyers.
إخلاء المسؤولية: الآراء الواردة هنا تعبر فقط عن رأي الكاتب، ولا تمثل الموقف الرسمي لـ Followme. لا تتحمل Followme مسؤولية دقة أو اكتمال أو موثوقية المعلومات المُقدمة، ولا تتحمل مسؤولية أي إجراءات تُتخذ بناءً على المحتوى، ما لم يُنص على ذلك صراحةً كتابيًا.

