


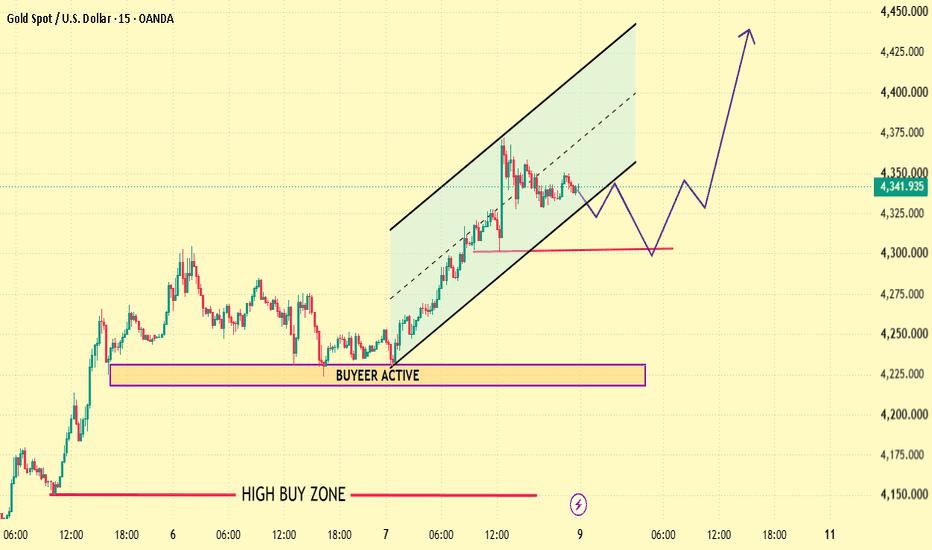
The chart shows Gold moving inside an ascending channel after establishing strong upward momentum. The lower channel boundary has been respected several times, creating a clear dynamic support structure.
The marked zone around 4300–4305 is positioned below current price and can be used as a key technical reference during any pullback.
Market Structure
Higher Highs ✅
Higher Lows ✅
Rising Channel ✅
Price Above Key Zone ✅
Reference Levels
4320 — short-term support
4300–4305 — key support zone
4360 — first resistance
4380 — second resistance
4420 — major resistance
4440 — extended level
Possible Path
4342 → 4360 → 4380 → 4420 → 4440
إخلاء المسؤولية: الآراء الواردة هنا تعبر فقط عن رأي الكاتب، ولا تمثل الموقف الرسمي لـ Followme. لا تتحمل Followme مسؤولية دقة أو اكتمال أو موثوقية المعلومات المُقدمة، ولا تتحمل مسؤولية أي إجراءات تُتخذ بناءً على المحتوى، ما لم يُنص على ذلك صراحةً كتابيًا.

