


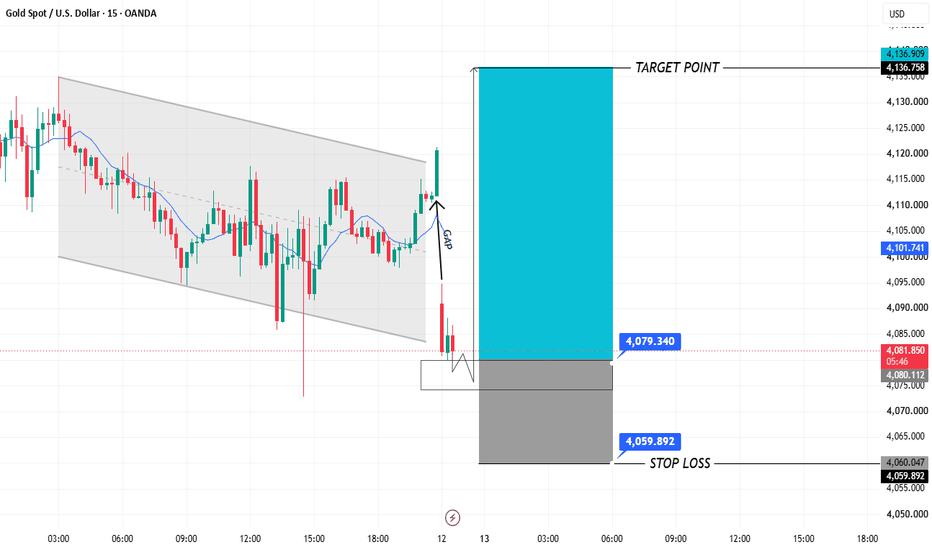
📊 Market Structure
Timeframe: 15 Minutes
Current Price: around 4083.8
Pattern: Descending channel followed by a bullish breakout
Key Event: Price pushed above the channel, created a gap/imbalance (FVG), and then retraced sharply into a support zone.
Bias: Bullish continuation while support holds.
🔍 What the Chart Shows
Price traded inside a falling channel for several hours.
A strong bullish candle broke above the upper trendline, signaling a potential trend reversal.
After the breakout, sellers stepped in aggressively, causing a fast pullback.
The pullback is currently testing the demand / support area around 4076–4080, which is also near the marked entry zone.
📈 Bullish Trade Idea
Entry Zone:4079.3 – 4080.1
Stop Loss:4059.9
Take Profit (Main):4136.8
Risk: ~19 points
Reward: ~57 points
Risk : Reward: approximately 1 : 3
🎯 Potential Targets
Target
Level
TP1
4102
TP2
4115
TP3
4125
TP4 (Final)
4136.8
⚠️ Important Resistance
4100–4102: Psychological and short-term resistance.
4115–4120: Previous swing highs.
4135–4137: Major target zone shown on the chart.
🛡️ Invalidation
A 15-minute candle closing below 4076 would weaken the bullish setup.
A break below 4059.9 invalidates the trade idea and could open the door for further downside.
📌 TradingView Style Summary
XAU/USD Bullish Breakout Retest | Buy the Support for 4136 Target
Bias: Bullish
Entry: 4079.34
SL: 4059.89
TP1: 4102
TP2: 4115
TP3: 4125
TP4: 4136.76
Setup: Channel breakout → pullback into demand → continuation higher.
إخلاء المسؤولية: الآراء الواردة هنا تعبر فقط عن رأي الكاتب، ولا تمثل الموقف الرسمي لـ Followme. لا تتحمل Followme مسؤولية دقة أو اكتمال أو موثوقية المعلومات المُقدمة، ولا تتحمل مسؤولية أي إجراءات تُتخذ بناءً على المحتوى، ما لم يُنص على ذلك صراحةً كتابيًا.

