


WTI Technical Analysis
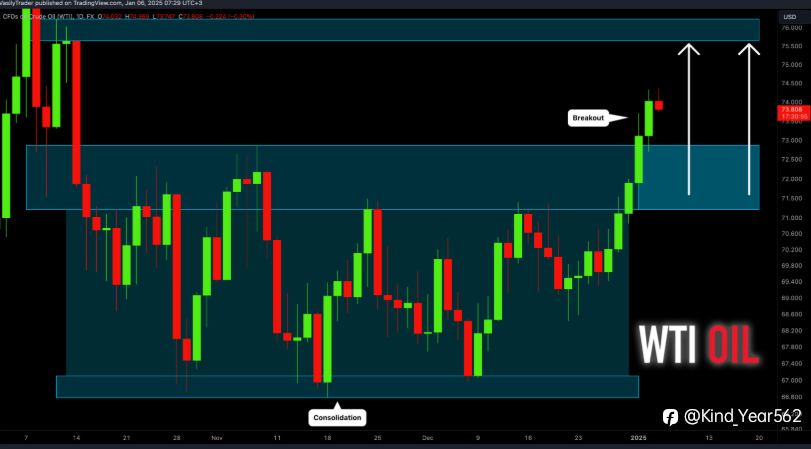
WTI Crude Oil continues to maintain a bearish broader technical structure, with price action showing weakness across the higher timeframes. The daily chart is forming a bearish candle and remains below the 20-SMA, indicating that sellers continue to have an advantage in the medium-term structure.
However, the intraday picture presents a slightly different scenario. With key support levels approaching, WTI could see a short-term recovery if buyers successfully defend the major support zones or trigger a confirmed breakout.
📊 Current Technical Structure
- Daily: Bearish Candle
- Daily Moving Average: Price trading below the 20-SMA
- 4H: Inverted Hammer
- 1H: Inverted Hammer
- Weekly Trend: Bearish
- Intraday Bias: Bullish to Neutral
- Preferred Strategy: Buy on Breakout / Buy on Support
The combination of a bearish daily structure and price trading below the 20-SMA suggests that the broader trend remains under pressure. At the same time, the inverted hammer formations on the 4H and 1H charts indicate that the market is encountering a potential area of indecision.
This creates an important distinction between the weekly bearish trend and the short-term opportunity for a corrective move higher.
🔻Major Support Levels
WTI traders should closely monitor the following downside levels:
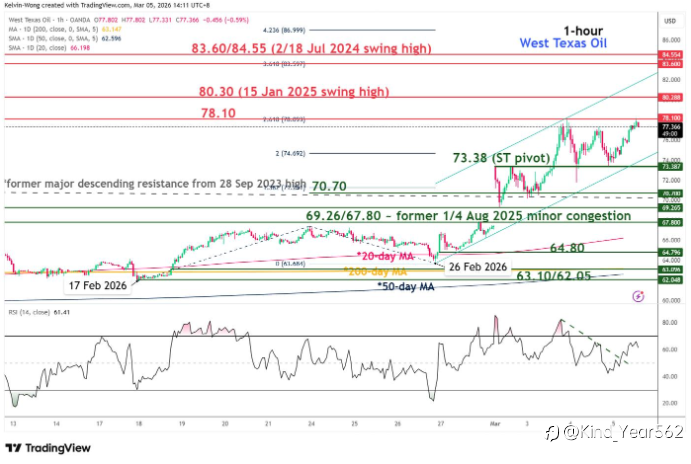
74.50 — First Major Support
A key level for buyers to defend. A sustained reaction from this zone could provide an opportunity for an intraday recovery.
72.70 — Second Major Support
If 74.50 fails, attention shifts toward 72.70 as the next important demand area.
70.90 — Major Lower Support
A decisive break below 72.70 could expose WTI to further downside pressure toward 70.90.
🔺 Major Resistance Levels
On the upside, traders should watch the following resistance zones:
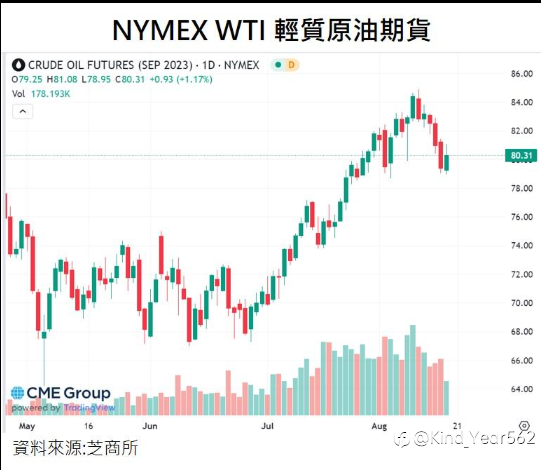
81.55 — First Major Resistance
A move toward this level would represent an important test for bullish momentum.
84.00 — Second Major Resistance
A sustained breakout above 81.55 could shift attention toward 84.00.
86.40 — Major Resistance
This remains the higher resistance target in the current technical framework.
📈 Intraday Trading Strategy
Despite the broader bearish weekly trend, the current intraday setup remains Bullish to Neutral.
The preferred approach is therefore to avoid chasing price and instead wait for confirmation around key technical levels.
Buy on Support
If WTI reacts positively from 74.50, 72.70, or 70.90, traders can watch for bullish confirmation before considering a long position.
Buy on Breakout
A confirmed breakout through an important resistance area could provide additional evidence that short-term bullish momentum is developing.
However, because the higher-timeframe trend remains bearish, breakout trades should ideally be supported by strong price confirmation rather than relying solely on a temporary move above resistance.
⚠️ Key Risk Scenario
The main risk to the short-term bullish-to-neutral view would be a decisive breakdown below the major support levels.
A sustained move below 70.90 would indicate increasing bearish pressure and could invalidate the current support-based bullish scenario.
🎯 Key Levels at a Glance
LevelType86.40Major Resistance84.00Resistance81.55Resistance74.50Major Support72.70Support70.90Major Support
Market Takeaway
The overall WTI structure remains bearish on the higher timeframe, supported by the bearish daily candle and price trading below the 20-SMA.
Nevertheless, the short-term setup is Bullish to Neutral, making the major support zones and breakout levels particularly important for intraday traders.
For now, the key approach is simple: watch the support levels for a confirmed reaction and monitor resistance for a potential breakout.
إخلاء المسؤولية: الآراء الواردة هنا تعبر فقط عن رأي الكاتب، ولا تمثل الموقف الرسمي لـ Followme. لا تتحمل Followme مسؤولية دقة أو اكتمال أو موثوقية المعلومات المُقدمة، ولا تتحمل مسؤولية أي إجراءات تُتخذ بناءً على المحتوى، ما لم يُنص على ذلك صراحةً كتابيًا.

