· Views 257
Market Analysis Using Smart Money Concepts
Overview
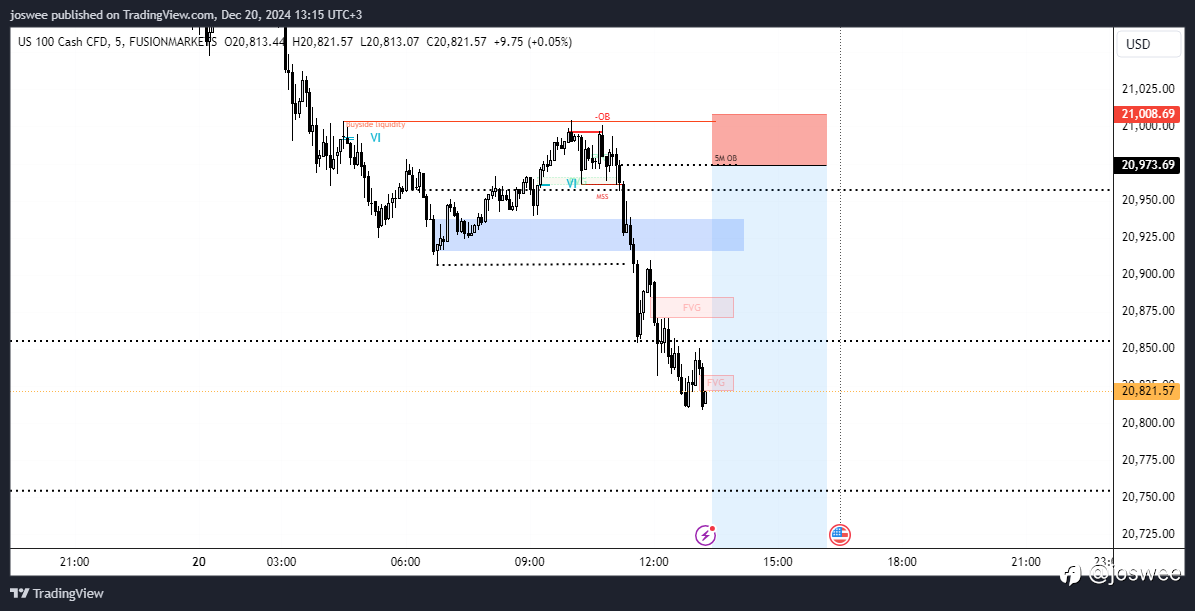
- Asset: US 100 Cash CFD
- Timeframe: 5-minute chart
Current Market Structure
- Trend: The market is exhibiting a clear downtrend characterized by lower highs and lower lows, indicating that sellers are in control.
Key Levels
- Order Blocks (OB)
- Daily OB: Located near the top of the chart, this area represents institutional interest for potential buying. Watch for price action around this zone as it may indicate a reversal.
- 5-Minute OB: Close to the current price action, this order block is essential for identifying short-term buying opportunities if the price retraces.
- Fair Value Gaps (FVG)
- There are two identified FVGs:
- FVG at the lower levels: This gap may act as support as price pulls back, providing a potential area for price discovery.
- FVG in the middle range: This may attract price back to fill where there was a fast movement away from, offering more trading opportunities.
- Liquidity Areas
- Upside Liquidity: The marked area indicates potential targets where price may seek liquidity, likely above resistance levels.
- Observing where buy orders (liquidity) are accumulated can provide insights for potential reversals or continuations.
Entry and Exit Points
- Buy Entry: Consider entering long positions if price approaches the 5-minute OB and shows signs of reversal (e.g., bullish candlestick formations).
- Sell Entry: Look to enter shorts if price fails to hold above the daily OB and begins to show bearish momentum.
- Targets: Set profit targets at FVG levels and structural highs/lows,
إخلاء المسؤولية: الآراء الواردة هنا تعبر فقط عن رأي الكاتب، ولا تمثل الموقف الرسمي لـ Followme. لا تتحمل Followme مسؤولية دقة أو اكتمال أو موثوقية المعلومات المُقدمة، ولا تتحمل مسؤولية أي إجراءات تُتخذ بناءً على المحتوى، ما لم يُنص على ذلك صراحةً كتابيًا.
هل أعجبك هذا المقال؟ عبّر عن امتنانك بإرسال نصيحة للكاتب.

اترك رسالتك الآن