| Scenario | |
|---|---|
| Timeframe | Weekly |
| Recommendations | BUY STOP |
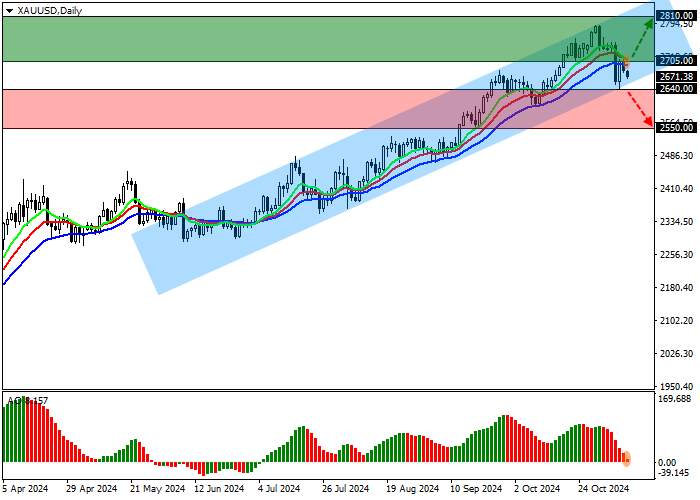
| Entry point | 2705.0 |
| Take Profit | 2810.0 |
| Stop Loss | 2650.0 |
| Key levels | 2550.0, 2550.0, 2705.0, 2810.0 |
| Alternative scenario | |
|---|---|
| Recommendations | SELL STOP |
| Entry point | 2640.0 |
| Take Profit | 2550.0 |
| Stop Loss | 2700.0 |
| Key levels | 2550.0, 2550.0, 2705.0, 2810.0 |
Current dynamics
The XAU/USD pair retreated from the 2800.00 level amid market volatility following Donald Trump's victory in the presidential election and the US Federal Reserve's -25 basis points interest rate adjustment, justified by the recovery of the labor market and inflation reaching the 2.0% target.
The decline in gold prices is confirmed by the growth in yields on leading bonds: the most popular 10-year US Treasuries are reaching the level of early July at 4.344%. If the regulator maintains its dovish rhetoric, metal prices will continue to strengthen: since the Chicago Mercantile Exchange (CME) FedWatch Tool reflects the probability of a change in the cost of borrowing in December by -25 basis points, amounting to 64.9%, the current downward trend in the XAU/USD pair does not look sustainable. The long-term dynamics of the asset are influenced by expectations of the implementation of the election program by the administration of new US President Donald Trump, which includes a revision of import tariffs, which may cause an acceleration of inflation, against which safe-haven assets such as gold will receive support.
A significant increase in demand for the asset is confirmed by data from the Chicago Mercantile Exchange (CME Group): since November 6, the volume of trading in gold contracts reached a peak of 611.0 thousand, after which it dropped slightly to the current 394.0 thousand, which is much higher than the average value of last month of 290.0-310.0 thousand.
Support and resistance levels
On the daily chart, the trading instrument is correcting above the support line of the long-term ascending channel 2820.0–2650.0.
Technical indicators weaken the buy signal: fast EMAs on the Alligator indicator are above the signal line, and the AO histogram forms correction bars above the transition level.
Resistance levels: 2705.0, 2810.0.
Support levels: 2640.0, 2550.0.

Trading scenarios
Long positions can be opened after the price grows and consolidates above the level of 2705.0 with the target of 2810.0. Stop loss is 2650.0. Implementation period: 7 days or more.
Short positions can be opened after the price declines and consolidates below 2640.0 with a target of 2550.0. Stop loss is 2700.0.
إخلاء المسؤولية: الآراء الواردة هنا تعبر فقط عن رأي الكاتب، ولا تمثل الموقف الرسمي لـ Followme. لا تتحمل Followme مسؤولية دقة أو اكتمال أو موثوقية المعلومات المُقدمة، ولا تتحمل مسؤولية أي إجراءات تُتخذ بناءً على المحتوى، ما لم يُنص على ذلك صراحةً كتابيًا.

اترك رسالتك الآن