
| Scenario | |
|---|---|
| Timeframe | Intraday |
| Recommendation | SELL STOP |
| Entry Point | 0.8630 |
| Take Profit | 0.8570 |
| Stop Loss | 0.8669 |
| Key Levels | 0.8541, 0.8570, 0.8600, 0.8631, 0.8669, 0.8700, 0.8730, 0.8776 |
| Alternative scenario | |
|---|---|
| Recommendation | BUY STOP |
| Entry Point | 0.8670 |
| Take Profit | 0.8730 |
| Stop Loss | 0.8631 |
| Key Levels | 0.8541, 0.8570, 0.8600, 0.8631, 0.8669, 0.8700, 0.8730, 0.8776 |
Current trend
During the morning session, the USD/CHF pair is moderately declining, consolidating near 0.8650 amid weakening market activity ahead of the US presidential election.
Thus, after a victory for the Republican candidate Donald Trump, an adjustment in the monetary rate may follow amid a new tariff policy and a weakening of geopolitical risks because of a more restrained approach to international relations, supporting the national currency in the long term. In addition, the US Fed will meet on Thursday. Analysts are confident that the cost of borrowing will change by –25 basis points to 4.75%, so traders will focus on subsequent comments from the regulator in the hope of receiving signals regarding another change in the indicator this year. Meanwhile, investors are assessing the October report on the US labor market. Nonfarm payrolls fell from 223.0K to 12.0K against the forecast of 113.0K, and the average hourly wage accelerated from 3.9% to 4.0% YoY and from 0.3% to 0.4% MoM, reflecting moderate risks of inflation growth. However, experts considered that the statistics were affected by two hurricanes in the country and a large protest action by employees of The Boeing Co., after which the dollar regained the lost positions.
In October, the Swiss consumer price index decreased from 0.8% to 0.6% YoY and increased from –0.3% to –0.1%. However, analysts expected zero dynamics in both cases. The September retail trade volume adjusted from 2.7% to 2.2% against preliminary estimates of 2.5%.
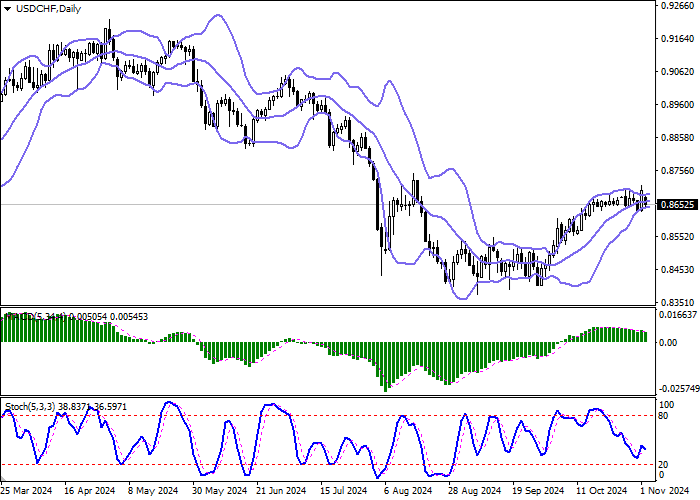
Support and resistance
On the daily chart, Bollinger bands reverse horizontally. The price range remains almost unchanged, reflecting the ambiguous nature of trading in the ultra-short term. The MACD indicator is declining, maintaining a poor sell signal (the histogram is below the signal line). Stochastic has resumed its decline and is near its lows, indicating that the American dollar may become oversold in the ultra-short term.
Resistance levels: 0.8669, 0.8700, 0.8730, 0.8776.
Support levels: 0.8631, 0.8600, 0.8570, 0.8541.
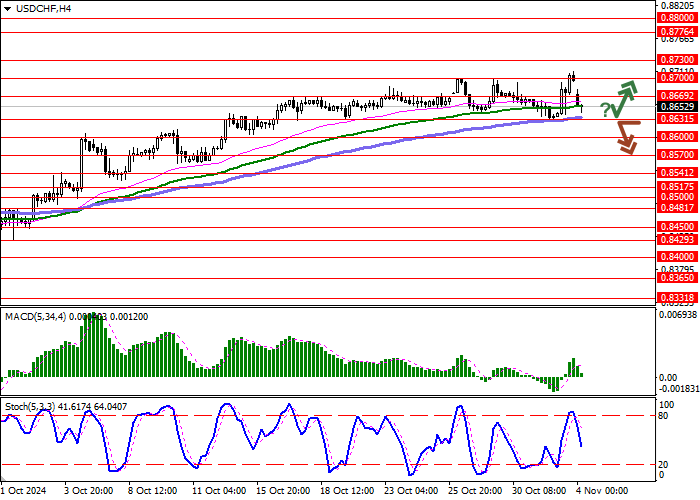
Trading tips
Short positions may be opened after a breakdown of 0.8631, with the target at 0.8570. Stop loss — 0.8669. Implementation period: 1–2 days.
Long positions may be opened after a rebound from 0.8631 and a breakout of 0.8669, with the target at 0.8730. Stop loss — 0.8631.
إخلاء المسؤولية: الآراء الواردة هنا تعبر فقط عن رأي الكاتب، ولا تمثل الموقف الرسمي لـ Followme. لا تتحمل Followme مسؤولية دقة أو اكتمال أو موثوقية المعلومات المُقدمة، ولا تتحمل مسؤولية أي إجراءات تُتخذ بناءً على المحتوى، ما لم يُنص على ذلك صراحةً كتابيًا.

اترك رسالتك الآن