
| Scenario | |
|---|---|
| Timeframe | Weekly |
| Recommendation | BUY STOP |
| Entry Point | 0.5380 |
| Take Profit | 0.5859, 0.6348 |
| Stop Loss | 0.5120 |
| Key Levels | 0.4300, 0.4639, 0.5020, 0.5371, 0.5859, 0.6348 |
| Alternative scenario | |
|---|---|
| Recommendation | SELL STOP |
| Entry Point | 0.5010 |
| Take Profit | 0.4639, 0.4300 |
| Stop Loss | 0.5260 |
| Key Levels | 0.4300, 0.4639, 0.5020, 0.5371, 0.5859, 0.6348 |
Current trend
This week, the XRP/USD pair attempted to grow, rising to the 0.5300 area, but has since lost all its gains.
Unlike most leading crypto assets, the XRP token’s growth is being held back by the uncertainty caused by the ongoing litigation initiated by the US Securities and Exchange Commission (SEC) against Ripple. The technology company recently tried again to appeal the ruling recognizing the XRP token as a security at the stage of direct sales to institutional investors and imposing a fine of 125.0 million dollars on it. Lawyers argue that the Howey test, which is used to qualify the transaction as an investment contract, was incorrectly applied.
Ripple will likely only be able to resolve the lawsuits if there is a change in the White House administration, at least according to the company's founder Brad Garlinghouse, who told CNBC last week that the “time of terror” against cryptocurrencies will end after the presidential election. Many other experts share the same opinion: they hope that if Republican candidate Donald Trump returns to the White House, the SEC will have officials more loyal to digital assets, which will allow it to receive permission to launch a Ripple ETF, which was previously applied for by Canary Capital and Bitwise.
Overall, the fundamental background for the XRP/USD pair remains complex, with significant price gains expected after the US presidential race concludes.
Support and resistance
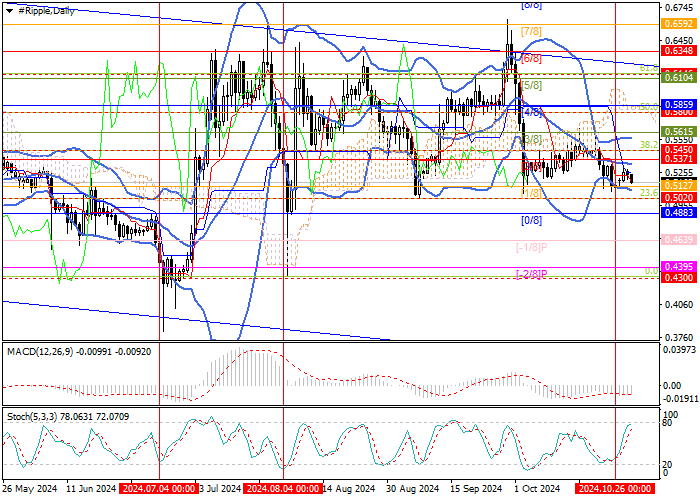
The asset is trading within the medium-term sideways range of 0.6348–0.5020 (Murrey level [6/8], 23.6% Fibonacci retracement) and now the price is at its lower border, consolidation below which may cause a further decline to the targets of 0.4639 (Murrey level [˗1/8]) and 0.4300 (the area of the July lows). If the 0.5371 mark (Murrey level [2/8], the central line of Bollinger Bands) is broken out, growth may resume to the targets of 0.5859 (Murrey level [4/8]) and 0.6348 (Murrey level [6/8]).
Technical indicators do not give a clear signal, illustrating the uncertainty of the market: Bollinger Bands are horizontal, MACD is stable in the negative zone, and Stochastic is directed upwards.
Resistance levels: 0.5371, 0.5859, 0.6348.
Support levels: 0.5020, 0.4639, 0.4300.
Trading tips
Long positions can be opened when the price consolidates above 0.5371 with targets at 0.5859, 0.6348 and a stop-loss at 0.5120. Implementation period: 5–7 days.
Short positions can be opened below 0.5020 with targets at 0.4639, 0.4300 and a stop-loss at 0.5260.
إخلاء المسؤولية: الآراء الواردة هنا تعبر فقط عن رأي الكاتب، ولا تمثل الموقف الرسمي لـ Followme. لا تتحمل Followme مسؤولية دقة أو اكتمال أو موثوقية المعلومات المُقدمة، ولا تتحمل مسؤولية أي إجراءات تُتخذ بناءً على المحتوى، ما لم يُنص على ذلك صراحةً كتابيًا.

اترك رسالتك الآن