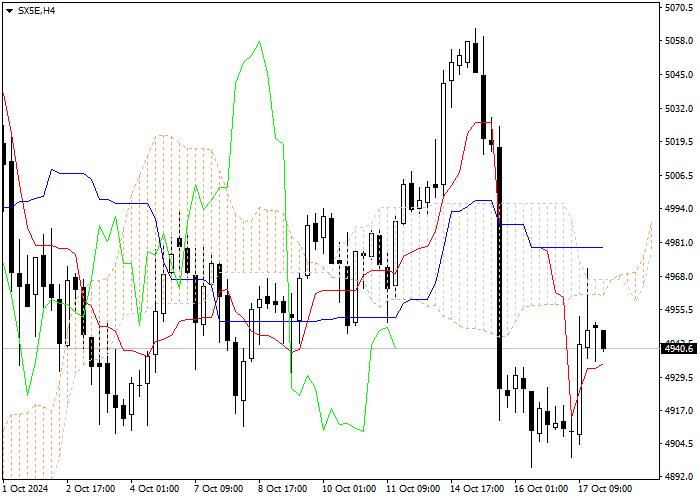
Let's look at the four-hour chart. Tenkan-sen line is below Kijun-sen, the lines are horizontal . Confirmative line Chikou Span is below the price chart, current cloud has reversed from ascending to descending. The instrument is trading below Tenkan-sen and Kijun-sen lines; the Bearish trend is still strong. Tenkan-sen and Kijun-sen lines have become support (4935.4) and resistance (4978.6) levels respectively
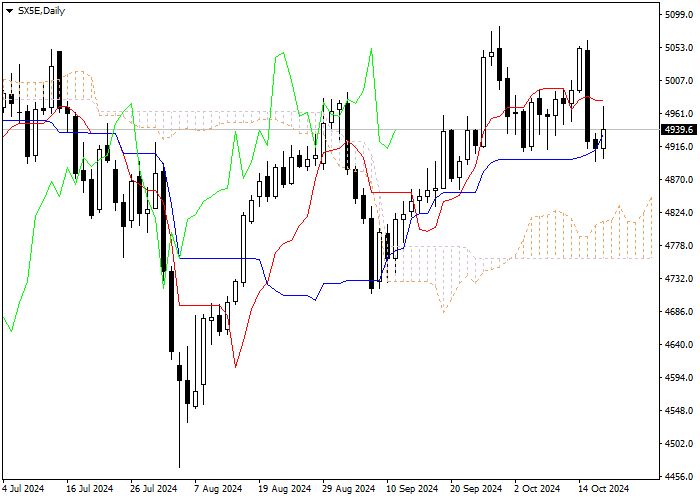
On the daily chart Tenkan-sen line is above Kijun-sen, the lines are horizontal . Confirmative line Chikou Span is above the price chart, current cloud is ascending. The instrument is trading between Tenkan-sen and Kijun-sen lines. The closest support level is the lower border of the cloud (4813.9). The closest resistance level is Tenkan-sen line (4979.7).
On the four-hour chart we can see a correction of the downward movement. On the daily chart we can see a correction of the upward movement. It is recommended to open long positions at current price with the target at the level of previous maximum of Chikou Span line (5300.0) and Stop Loss at the upper border of the cloud (4813.9).
إخلاء المسؤولية: الآراء الواردة هنا تعبر فقط عن رأي الكاتب، ولا تمثل الموقف الرسمي لـ Followme. لا تتحمل Followme مسؤولية دقة أو اكتمال أو موثوقية المعلومات المُقدمة، ولا تتحمل مسؤولية أي إجراءات تُتخذ بناءً على المحتوى، ما لم يُنص على ذلك صراحةً كتابيًا.
هل أعجبك هذا المقال؟ عبّر عن امتنانك بإرسال نصيحة للكاتب.

اترك رسالتك الآن