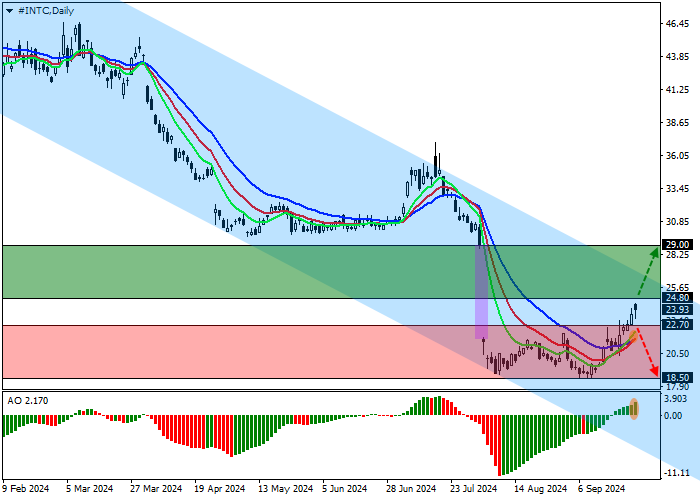
Shares of Intel Corp., a giant in the development and sale of electronic devices and computer components, are trading at 24.00.
On the daily chart, the price is moving in the correction channel 26.00–18.00, approaching the resistance line.
On the four-hour chart, the probability of continued growth increased after a breakout of the high of 22.00. The quotes began to implement the price gap 29.00–22.00. In case of its complete closure, the target for the upward dynamics will be reached.
Technical indicators gave a buy signal: the EMA fluctuation range on the Alligator indicator is expanding upwards, fast EMAs are moving away from the signal line, and the AO histogram is forming ascending bars above the transition level.

Trading tips
Long positions may be opened after the price grows and consolidates above 24.80, with the target at 29.00. Stop loss — 22.00. Implementation period: 7 days or more.
Short positions may be opened after the price declines and consolidates below 22.70, with the target at 18.50 and stop loss 25.00.