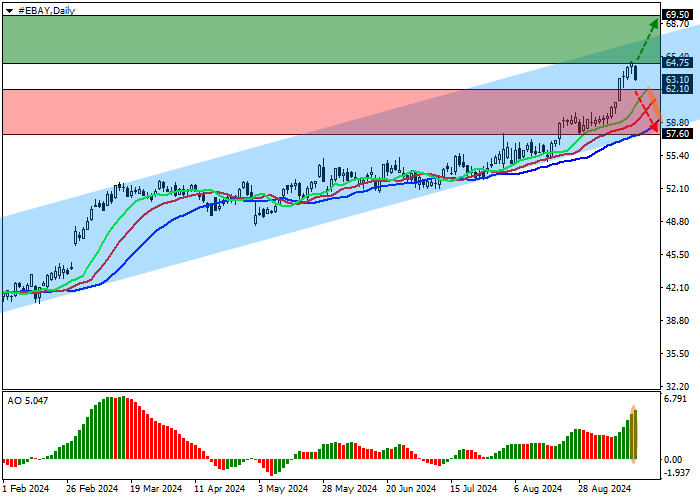
Shares of eBay Inc., the U.S. online retailer, are trading in the 63.00 zone.
On the daily chart, the price is approaching the resistance line of the ascending channel 69.00–59.00.
On the H4 chart, the price is trying to leave the long-term channel, and after consolidating above the yearly high at 64.80, the asset will aim for the target of 69.00. If there is a breakout through it, the price is likely to make a new low at 62.00 and move to the channel support line.
Technical indicators are giving a buy signal: the fast EMAs on the "Alligator" indicator are above the signal line, and the AO histogram is forming bullish bars in the buy zone.

Trading scenarios
Long positions can be opened after the price rises and consolidates above 64.75, with a target of 69.50 and a stop loss at 62.00. Timeframe: 7 days or more.
It is possible to consider opening short positions, after the price consolidates below 62.10, with a take profit target at 57.60. Stop loss — below 64.00.