
USD/CAD: WAVE ANALYSIS

avatar
· Views 160


USD/CAD: WAVE ANALYSIS
Script
Time frameWeekly
RecommendationBUY
Entry point1.3601
Take Profit1.3690, 1.3750
Cut loss1.3540
Level of importance1.2975, 1.3208, 1.3465, 1.3690, 1.3750
Other options
RecommendationSELL STOP
Entry point1.3460
Take Profit1.3208, 1.2975
Cut loss1.3545
Level of importance1.2975, 1.3208, 1.3465, 1.3690, 1.3750

Price is in correction zone, possibility of increase is maintained.

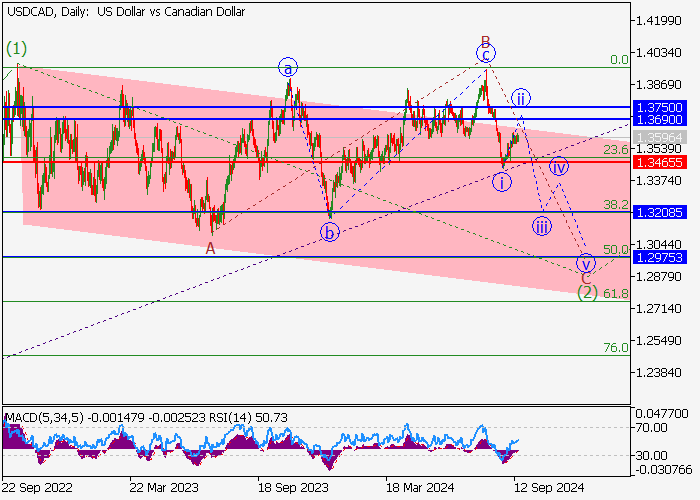
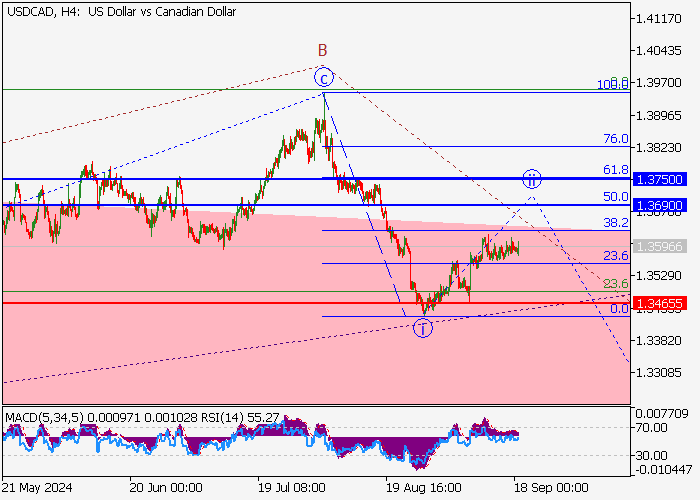
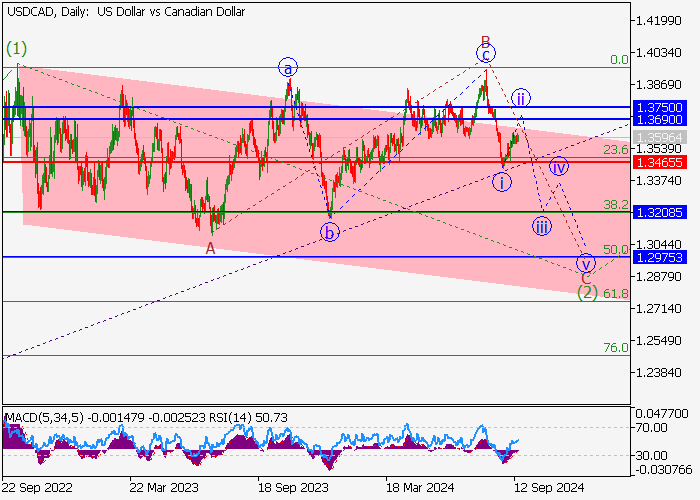
On the daily chart, the first bullish wave of the major level (1) of 5 has formed, and is continuing to develop a correction in the form of the second wave (2) of 5. Currently, wave C of (2) is recorded, which has completed wave i of C and is developing a correction in the form of wave ii of C. If this assessment is correct, the USD/CAD pair will rise to the zone of 1.3690–1.3750. The maximum stop loss for this scenario is 1.3465.

USD/CAD: WAVE ANALYSIS

USD/CAD: WAVE ANALYSIS

Main script

Consider opening a buy order above 1.3465 with a target to take profit in the 1.3690–1.3750 zone. Timeframe: 7 days or more.

Alternative scenario

The breakout and consolidation of the price below the 1.3465 level allowed the trading instrument to continue the downtrend to the 1.3208–1.2975 zone.


إخلاء المسؤولية: الآراء الواردة هنا تعبر فقط عن رأي الكاتب، ولا تمثل الموقف الرسمي لـ Followme. لا تتحمل Followme مسؤولية دقة أو اكتمال أو موثوقية المعلومات المُقدمة، ولا تتحمل مسؤولية أي إجراءات تُتخذ بناءً على المحتوى، ما لم يُنص على ذلك صراحةً كتابيًا.

هل أعجبك هذا المقال؟ عبّر عن امتنانك بإرسال نصيحة للكاتب.
الرد 0

  • tradingContest
