| Scenario | |
|---|---|
| Timeframe | Weekly |
| Recommendation | SELL STOP |
| Entry Point | 39100.0 |
| Take Profit | 38000.0 |
| Stop Loss | 39500.0 |
| Key Levels | 38000.0, 39100.0, 39800.0, 40900.0 |
| Alternative scenario | |
|---|---|
| Recommendation | BUY STOP |
| Entry Point | 39800.0 |
| Take Profit | 40900.0 |
| Stop Loss | 39400.0 |
| Key Levels | 38000.0, 39100.0, 39800.0, 40900.0 |
Current trend
The Dow Jones Index is correcting in a local trend at 39431.0, rising against the backdrop of fairly stable financial statements of component companies.
Yesterday, gold producer Barrick Gold Corp. published its results, with revenue amounting to 3.16 billion dollars, the highest quarterly figure since 2022, exceeding both the 3.14 billion dollars analysts had forecast and the 2.83 billion dollars recorded over the same period a year earlier. Earnings per share (EPS) increased to 0.32 dollars from 0.19 dollars, with expectations of 0.27 dollars.
Today, the financial report of the retail chain for the sale of building materials, The Home Depot Inc., will be presented: according to analysts' estimates, the company's revenue may amount to 42.60 billion dollars, after 36.42 billion dollars over the previous quarter and 42.90 billion dollars shown a year earlier. EPS are expected around 4.54 dollars, which will exceed 3.63 dollars in the previous quarter and approach 4.65 dollars recorded a year earlier.
A local upward correction in the bond market remains: the yield rate on 10-year debt securities rose to 3.918% from 3.812%, and on 20-year ones – to 4.305% from 4.234%.
The growth leaders in the index are UnitedHealth Group Inc. ( 1.17%), Walmart Inc. ( 1.10%), Apple Inc. ( 0.71%).
The leaders of decline are Boeing Co. (˗2.25%), Procter & Gamble Co. (˗2.19%), Intel Corp. (˗1.78%).
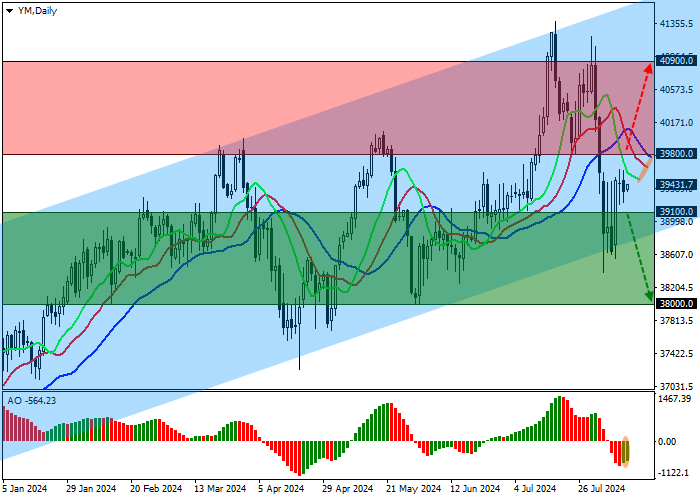
Support and resistance
On the D1 chart, the quotes continue their corrective dynamics, again approaching the support line of the descending channel with boundaries of 41500.0–38800.0.
Technical indicators that hold the downward signal continue to gradually strengthen it: the range of oscillations of the EMAs of the Alligator indicator is expanding, and the AO histogram is forming new corrective bars, being below the transition level.
Support levels: 39100.0, 38000.0.
Resistance levels: 39800.0, 40900.0.

Trading tips
In case of a reversal and continued decline of the asset, as well as consolidation of the price below the support level of 39100.0, sell positions with a target of 38000.0 may be opened. Stop loss – 39500.0. Implementation period: 7 days or more.
In case of continued growth of the asset, buy positions will be relevant, which can be opened after overcoming the resistance level of 39800.0 with a target of 40900.0 and stop-loss of 39400.0.
إخلاء المسؤولية: الآراء الواردة هنا تعبر فقط عن رأي الكاتب، ولا تمثل الموقف الرسمي لـ Followme. لا تتحمل Followme مسؤولية دقة أو اكتمال أو موثوقية المعلومات المُقدمة، ولا تتحمل مسؤولية أي إجراءات تُتخذ بناءً على المحتوى، ما لم يُنص على ذلك صراحةً كتابيًا.

اترك رسالتك الآن