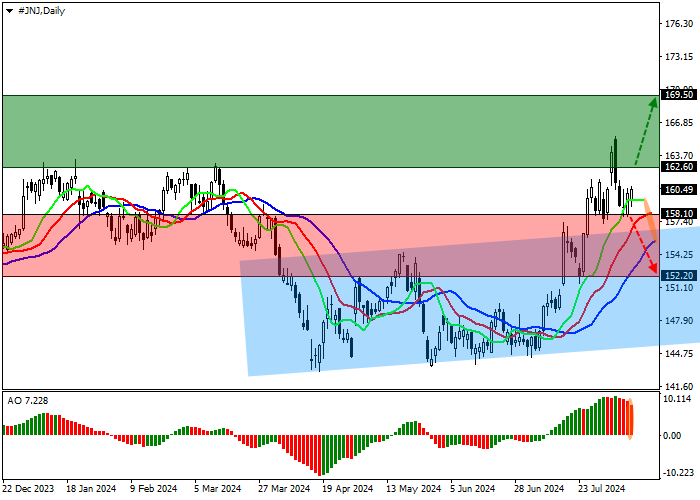
The shares of Johnson & Johnson, one of the leading retail holdings, are correcting at 160.00.
On the daily chart, the price is holding above the resistance line of the ascending channel with dynamic boundaries of 157.00–145.00.
On the four-hour chart, the current decline is probably an attempt to reverse test the resistance line of the channel at 157.00, after which the growth will continue to the annual high of 165.00. A decline is possible after a consolidation below 155.00 and a return of the price into the range.
Technical indicators are holding a buy signal: the EMA oscillation range on the Alligator indicator is expanding in the direction of growth, and the AO histogram is forming correction bars above the transition level.

Trading tips
Long positions may be opened after the price grows and consolidates above 162.60, with the target at 169.50. Stop loss — 160.00. Implementation period: 7 days or more.
Short positions may be opened after the price declines and consolidates below 158.10, with the target at 152.20. Stop loss — 161.00.

اترك رسالتك الآن