


| Scenario | |
|---|---|
| Timeframe | Weekly |
| Recommendation | BUY STOP |
| Entry Point | 0.6580 |
| Take Profit | 0.6660 |
| Stop Loss | 0.6540 |
| Key Levels | 0.6450, 0.6540, 0.6580, 0.6660 |
| Alternative scenario | |
|---|---|
| Recommendation | SELL STOP |
| Entry Point | 0.6540 |
| Take Profit | 0.6450 |
| Stop Loss | 0.6600 |
| Key Levels | 0.6450, 0.6540, 0.6580, 0.6660 |
Current trend
Amid neutral macroeconomic statistics from Australia, the AUD/USD pair is correcting upwards, trading at 0.6555.
Positive dynamics are developing against investors’ reaction to the decision of the Reserve Bank of Australia (RBA) to keep the interest rate at 4.35% and the rate on balances of funds for exchange – around 4.25%. The head of the regulator, Michelle Bullock, confirmed that officials discussed the possibility of increasing the cost of borrowing but concluded that its size is currently sufficient, and the short-term decline in indicators does not correspond to the opinion of board members. In addition, inflation averaged 3.9%, above the target range of 2.0–3.0%, and, according to the new forecast, will approach it no earlier than the second half of 2025, preventing the easing of monetary parameters.
The American dollar failed to hold on to the uptrend and is trading at 102.70 in USDX today. Yesterday, data on the US lending market was published, reflecting a local increase in demand from consumers: the MBA Home Purchase Applications Index rose from 132.8 points to 133.9 points, and the 30-year mortgage rate fell from 6.82% to 6.55%, the lowest since May 2023. Against this background, the weekly mortgage lending index adjusted from –3.9% to 6.9%, and the overall market indicator – from 201.2 points to 215.1 points.
Support and resistance
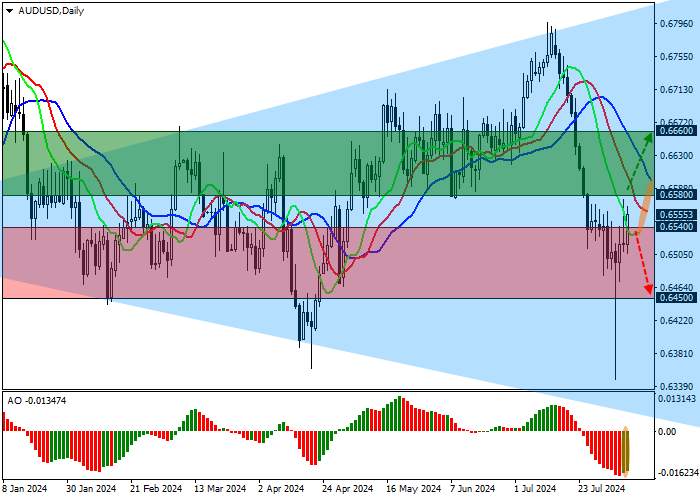
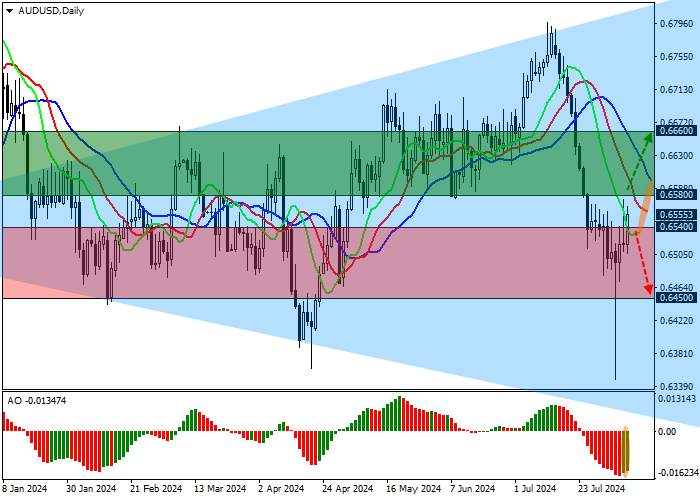
On the daily chart, the trading instrument is correcting, retreating from the support line of the Expanding formation pattern with dynamic boundaries of 0.6810–0.6310.
Technical indicators are holding the sell signal: fast EMA on the Alligator indicator are approaching the signal line, narrowing the range of fluctuations, and the AO histogram is increasing in the sell zone.
Resistance levels: 0.6580, 0.6660.
Support levels: 0.6540, 0.6450.
Trading tips
Long positions may be opened after the price rises and consolidates above 0.6580, with the target at 0.6660. Stop loss — 0.6540. Implementation period: 7 days or more.
Short positions may be opened after the price falls and consolidates below 0.6540, with the target at 0.6450. Stop loss – 0.6600.
إخلاء المسؤولية: الآراء الواردة هنا تعبر فقط عن رأي الكاتب، ولا تمثل الموقف الرسمي لـ Followme. لا تتحمل Followme مسؤولية دقة أو اكتمال أو موثوقية المعلومات المُقدمة، ولا تتحمل مسؤولية أي إجراءات تُتخذ بناءً على المحتوى، ما لم يُنص على ذلك صراحةً كتابيًا.
اترك رسالتك الآن