


| Scenario | |
|---|---|
| Timeframe | Intraday |
| Recommendation | BUY STOP |
| Entry Point | 0.6030 |
| Take Profit | 0.6100 |
| Stop Loss | 0.6000 |
| Key Levels | 0.5885, 0.5920, 0.5950, 0.5975, 0.6000, 0.6030, 0.6047, 0.6068 |
| Alternative scenario | |
|---|---|
| Recommendation | SELL STOP |
| Entry Point | 0.5970 |
| Take Profit | 0.5920 |
| Stop Loss | 0.6000 |
| Key Levels | 0.5885, 0.5920, 0.5950, 0.5975, 0.6000, 0.6030, 0.6047, 0.6068 |
Current trend
The NZD/USD pair is showing moderate growth, developing a fairly strong "bullish" trend in the short term, which was interrupted by a sharp decline on Monday. The instrument is testing 0.6000 for a breakout, while trading participants are analyzing macroeconomic statistics. The Reserve Bank of New Zealand's (RBNZ) Inflation Expectations for the third quarter were revised to 2.03% from 2.33%, which could put pressure on the regulator to further reduce borrowing costs.
The day before, New Zealand published a report on the labor market for the second quarter, according to which the Employment Rate increased by 0.4% after –0.2%, while analysts expected –0.2%, the Labor Cost Index in quarterly terms increased by 0.9%, accelerating by 0.1% from the previous value, and in annual terms a slowdown was recorded from 3.8% to 3.6% with a forecast of 3.5%. The Unemployment Rate rose sharply from 4.3% to 4.6%, while experts had expected 4.7%.
Today at 14:30 (GMT 2), the US will present data on the dynamics of jobless claims: Initial Jobless Claims for the week ended August 2 may decrease from 249.0 thousand to 240.0 thousand. Currently, the focus of American investors remains on the July report on the labor market: a sharp rise in unemployment has alarmed analysts, but now most observers believe that, despite the cooling of the key industry, a recession in the national economy will not occur. Moreover, experts expect a more significant adjustment in the US Federal Reserve's monetary policy, which will provide support for the dynamics of Gross Domestic Product (GDP). JPMorgan Chase & Co. analysts expect three cuts in borrowing costs during the year: by 50 basis points in September and November, and by another 25 basis points in December, although a more cautious approach is also possible.
Support and resistance
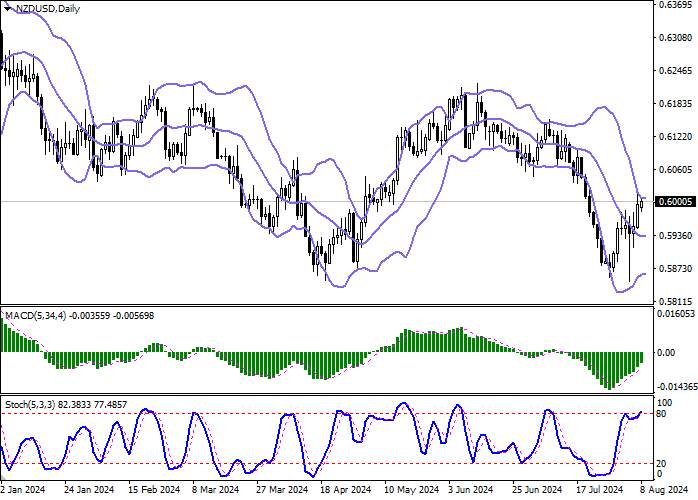
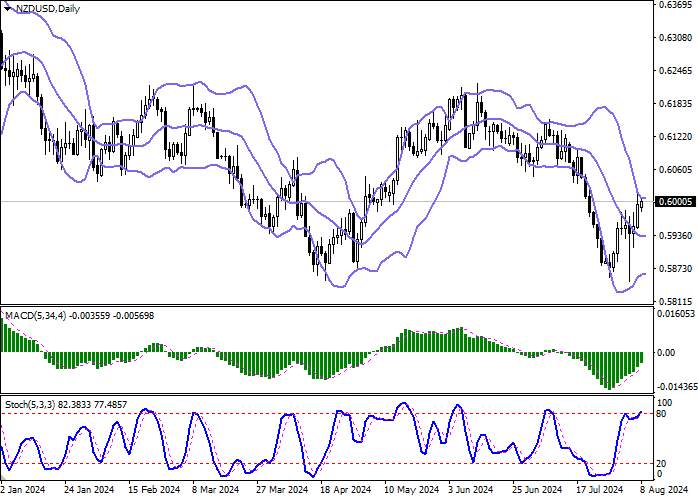
In the D1 chart, Bollinger Bands are reversing horizontally. The price range remains virtually unchanged, limiting the development of short-term "bulls". MACD grows, preserving a stable buy signal (located above the signal line). Stochastic demonstrates similar dynamics; however, the indicator is located in close proximity to its highs, indicating the risks of the instrument being overbought in the ultra-short term.
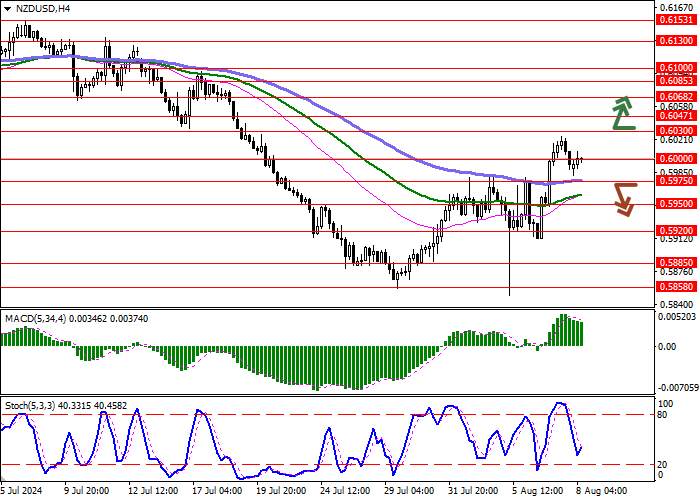
Resistance levels: 0.6000, 0.6030, 0.6047, 0.6068.
Support levels: 0.5975, 0.5950, 0.5920, 0.5885.
Trading tips
Long positions can be opened after a breakout of 0.6030 with the target of 0.6100. Stop-loss — 0.6000. Implementation time: 2-3 days.
The return of a "bearish" trend with the breakdown of 0.5975 may become a signal for new short positions with the target at 0.5920. Stop-loss — 0.6000.
إخلاء المسؤولية: الآراء الواردة هنا تعبر فقط عن رأي الكاتب، ولا تمثل الموقف الرسمي لـ Followme. لا تتحمل Followme مسؤولية دقة أو اكتمال أو موثوقية المعلومات المُقدمة، ولا تتحمل مسؤولية أي إجراءات تُتخذ بناءً على المحتوى، ما لم يُنص على ذلك صراحةً كتابيًا.

اترك رسالتك الآن