


| Scenario | |
|---|---|
| Timeframe | Weekly |
| Recommendation | SELL STOP |
| Entry Point | 0.4880 |
| Take Profit | 0.4300, 0.3906 |
| Stop Loss | 0.5240 |
| Key Levels | 0.3906, 0.4300, 0.4883, 0.5859, 0.6348, 0.6836 |
| Alternative scenario | |
|---|---|
| Recommendation | BUY STOP |
| Entry Point | 0.5870 |
| Take Profit | 0.6348, 0.6836 |
| Stop Loss | 0.5590 |
| Key Levels | 0.3906, 0.4300, 0.4883, 0.5859, 0.6348, 0.6836 |
Current trend
This week, the XRP/USD pair is moving within the general market trend: at first, quotes fell to the area of five-week lows of 0.4300, but currently they are trying to regain positions.
The driver of the downtrend was the reaction of investors to the publication of macroeconomic statistics from the United States: weak July labor market data, which recorded an increase in the unemployment rate to 4.3% and a slowdown in the number of nonfarm payrolls to 114.0 thousand, against the background of the high interest rate of the US Federal Reserve, raised concerns about the too serious weakening of the national economy and even its the transition to a recession, followed by a rapid decline in the stock and cryptocurrency markets, which have a serious correlation. However, the subsequent comments by the regulator's officials somewhat reassured investors, and the publication of strong July statistics on the Services PMI (growth from 49.6 points to 54.5 points) convinced them that the probability of a reduction in gross domestic product (GDP) in the near future is insignificant. These data led to an upward price correction, supported by new statements by Republican presidential candidate Donald Trump that the United States should not sell existing cryptocurrencies, and also allowed the use of BTC to pay off government debt.
Support and resistance
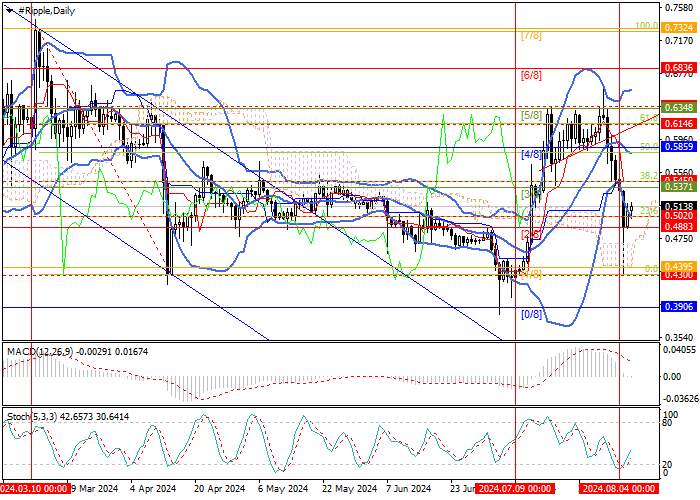
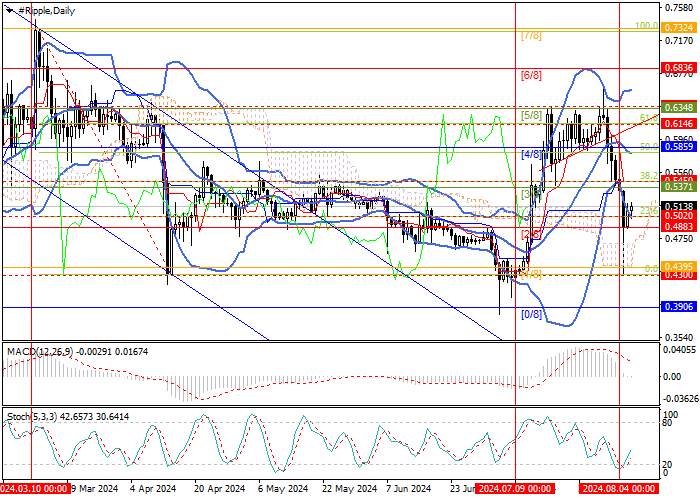
The price adjusted upwards and returned to the lower Bollinger Band, however, to resume significant growth, quotes need to consolidate above the 0.5859 mark (Murrey level [4/8], 50.0% Fibonacci retracement, the central line of Bollinger Bands). In this case, the quotes will be able to return to the targets of 0.6348 (Murrey level [5/8]) and 0.6836 (Murrey level [6/8]). The key for the "bears" is the support zone of 0.5020–0.4883 (23.6% Fibonacci retracement, Murrey level [2/8]), after consolidation below which the decline can continue to 0.4300 (five-week lows), 0.3906 (Murrey level [0/8]).
Technical indicators do not give a clear signal: Bollinger Bands are reversing down, and MACD is moving into a negative zone, which confirms the formation of a short-term downtrend, but Stochastic is reversing up from the oversold zone, which does not exclude continued growth.
Resistance levels: 0.5859, 0.6348, 0.6836.
Support levels: 0.4883, 0.4300, 0.3906.
Trading tips
Short positions can be opened below 0.4883 with targets of 0.4300, 0.3906 and stop-loss of 0.5240. Implementation period: 5–7 days.
Long positions can be opened above the 0.5859 mark with targets of 0.6348, 0.6836 and stop-loss of 0.5590.
إخلاء المسؤولية: الآراء الواردة هنا تعبر فقط عن رأي الكاتب، ولا تمثل الموقف الرسمي لـ Followme. لا تتحمل Followme مسؤولية دقة أو اكتمال أو موثوقية المعلومات المُقدمة، ولا تتحمل مسؤولية أي إجراءات تُتخذ بناءً على المحتوى، ما لم يُنص على ذلك صراحةً كتابيًا.

اترك رسالتك الآن