Current trend
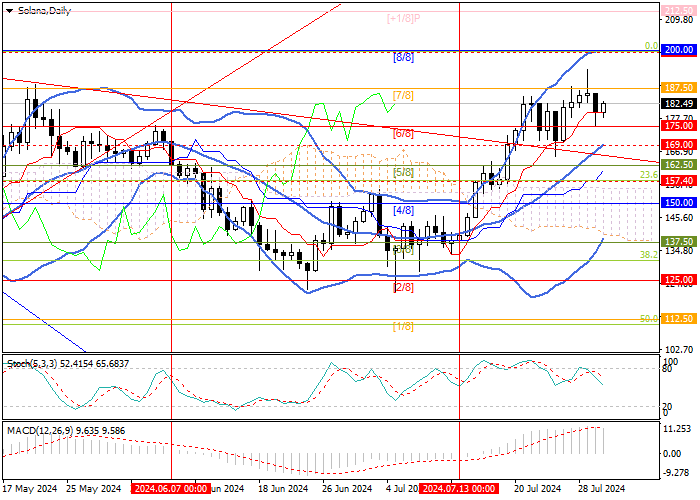
The SOL/USD pair has been actively adding value for the third week in a row: on Monday, the quotes reached a four-month high around 193.80, but then lost some of the gained positions.
To start a serious correction with an attempt to change the trend, the price needs to consolidate below the central line of Bollinger Bands around 169.00: in this case, the decline can continue to the levels of 150.00 (Murrey level [4/8]) and 137.50 (Murrey level [3/8]). The key mark for the "bulls" remains 187.50 (Murrey level [7/8]), consolidation above which will be the catalyst for reaching 200.00 (Murrey level [8/8]) and 212.50 (Murrey level [ 1/8]).
The uptrend in the market remains, which is confirmed by the upward reversal of Bollinger Bands and MACD increasing in the positive zone, as Stochastic's reversal down from the overbought zone does not exclude a correction but its potential is seen to be limited.
Support and resistance
Resistance levels: 187.50, 200.00, 212.50.
Support levels: 169.00, 150.00, 137.50.
Trading tips
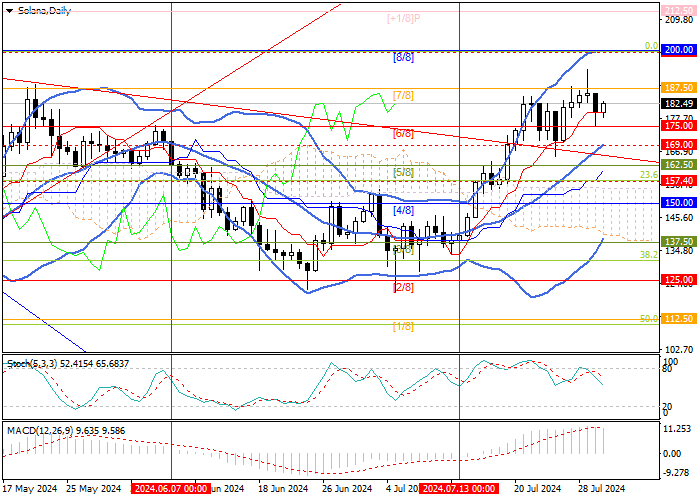
Long positions can be opened above the 187.50 mark or after the price reversal around 169.00 with targets of 200.00, 212.50 and stop-losses of 178.00 and 159.30, respectively. Implementation period: 5–7 days.