


| Scenario | |
|---|---|
| Timeframe | Weekly |
| Recommendation | SELL STOP |
| Entry Point | 109.25 |
| Take Profit | 95.60 |
| Stop Loss | 113.00 |
| Key Levels | 95.60, 109.30, 117.50, 135.70 |
| Alternative scenario | |
|---|---|
| Recommendation | BUY STOP |
| Entry Point | 117.55 |
| Take Profit | 135.70 |
| Stop Loss | 112.00 |
| Key Levels | 95.60, 109.30, 117.50, 135.70 |
Current trend
Shares of Nvidia Corp., an American developer of video graphics processors, are correcting at 112.29.
Increased interest in artificial intelligence (AI) chips has helped the company's share price double this year to above 1100.0, keeping retail players from investing more heavily in the stock. For this reason, on June 7, for the second time in three years, a 10:1 split of the shares was carried out in order to increase their liquidity and make them more accessible. A similar transaction with a 4:1 ratio in May 2021 allowed Nvidia Corp. quotes to add 500.0% in value. However, Nvidia Corp., Microsoft Corp., Meta Platforms Inc. and other tech giants have warned market participants that investing in artificial intelligence can be risky, perhaps to deflect liability and prevent potential lawsuits in the future.
Meanwhile, Nvidia Corp. management noted that it is preparing to release another graphics processor model aimed at China and designed to comply with US export regulations: the new chip, tentatively called "B20," will be released by partner Inspur Group and will debut in the second quarter of 2025. The developers estimate that it will be 30 times faster than its predecessor at performing tasks such as providing responses from chatbots. Last year, the Chinese market accounted for up to 17.0% of the issuer's total revenue, and two years ago, Nvidia Corp's sales volume there reached 22.0% of total revenue.
Support and resistance
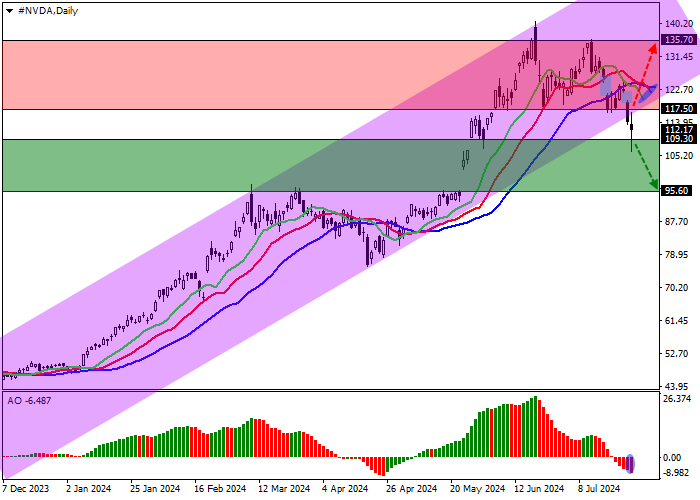
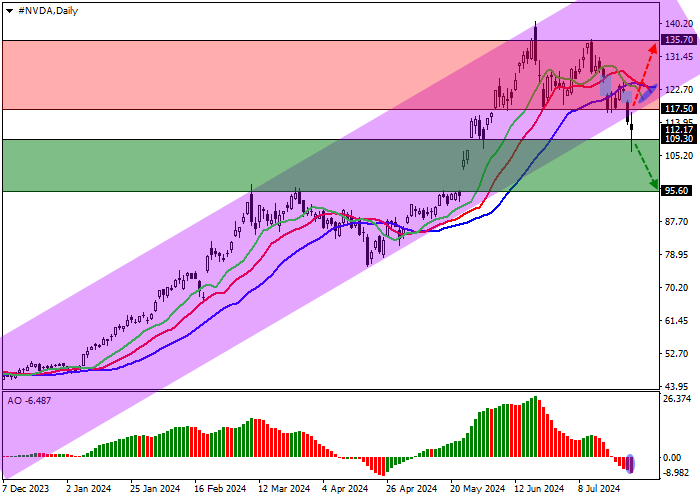
On the daily chart, the price continues its corrective movement, having made a successful attempt to overcome the support line of the ascending channel with boundaries of 141.00–116.00.
Technical indicators reversed and issued a new sell signal: the fluctuation range of the EMA of the Alligator indicator begins to actively expand in the direction of decline, and the AO histogram, already below the transition level, forms new correction bars.
Support levels: 109.30, 95.60.
Resistance levels: 117.50, 135.70.
Trading tips
If the asset reverses and continues declining, and the price consolidates below the local support level at 109.30, short positions can be opened with the target at 95.60. Stop-loss — 113.00. Implementation time: 7 days and more.
If the asset continues to grow, as well as the price consolidates above the resistance level of 117.50, long positions with a target of 135.70 will be relevant. Stop-loss — 112.00.
إخلاء المسؤولية: الآراء الواردة هنا تعبر فقط عن رأي الكاتب، ولا تمثل الموقف الرسمي لـ Followme. لا تتحمل Followme مسؤولية دقة أو اكتمال أو موثوقية المعلومات المُقدمة، ولا تتحمل مسؤولية أي إجراءات تُتخذ بناءً على المحتوى، ما لم يُنص على ذلك صراحةً كتابيًا.

