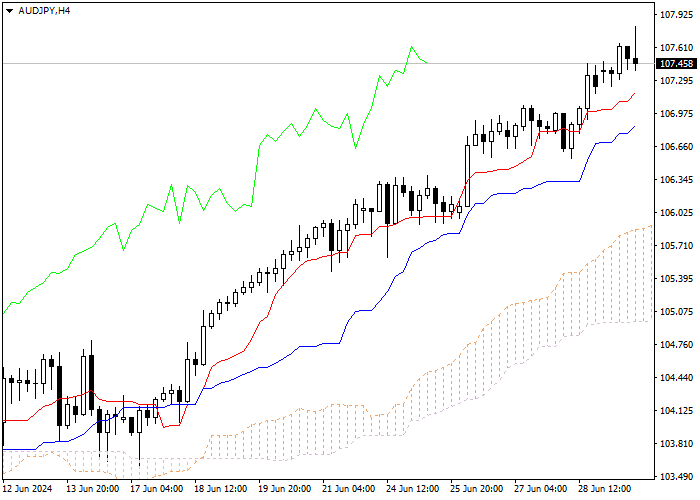
Let's look at the four-hour chart. Tenkan-sen line is above Kijun-sen, both lines are directed upwards. Confirmative line Chikou Span is above the price chart, current cloud is ascending. The instrument is trading above Tenkan-sen and Kijun-sen lines; the Bullish trend is still strong. One of the previous minimums of Chikou Span line is expected to be a support level (108.448). The closest resistance level is Kijun-sen line (106.933).
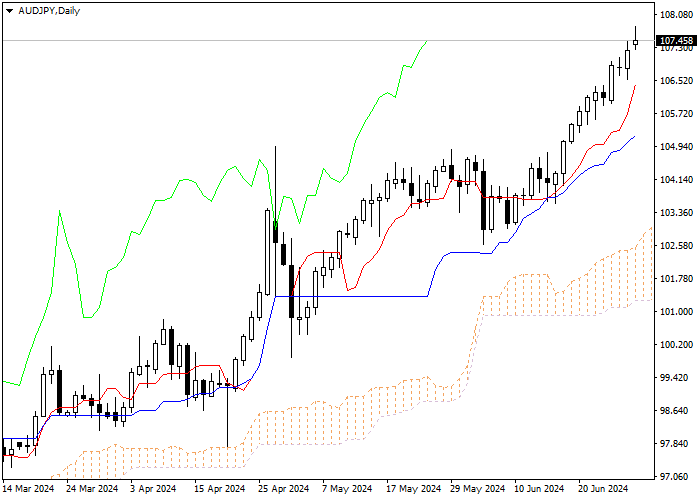
On the daily chart Tenkan-sen line is above Kijun-sen, both lines are directed upwards. Confirmative line Chikou Span is above the price chart, current cloud is ascending. The instrument is trading above Tenkan-sen and Kijun-sen lines; the Bullish trend is still strong. One of the previous minimums of Chikou Span line is expected to be a support level (108.454). The closest resistance level is Tenkan-sen line (106.928).
It is recommended to open long positions at current price with Take Profit at the level of previous maximum of Chikou Span (108.448) line and Stop Loss at the level of Kijun-sen line (106.933).
إخلاء المسؤولية: الآراء الواردة هنا تعبر فقط عن رأي الكاتب، ولا تمثل الموقف الرسمي لـ Followme. لا تتحمل Followme مسؤولية دقة أو اكتمال أو موثوقية المعلومات المُقدمة، ولا تتحمل مسؤولية أي إجراءات تُتخذ بناءً على المحتوى، ما لم يُنص على ذلك صراحةً كتابيًا.
هل أعجبك هذا المقال؟ عبّر عن امتنانك بإرسال نصيحة للكاتب.