Current trend
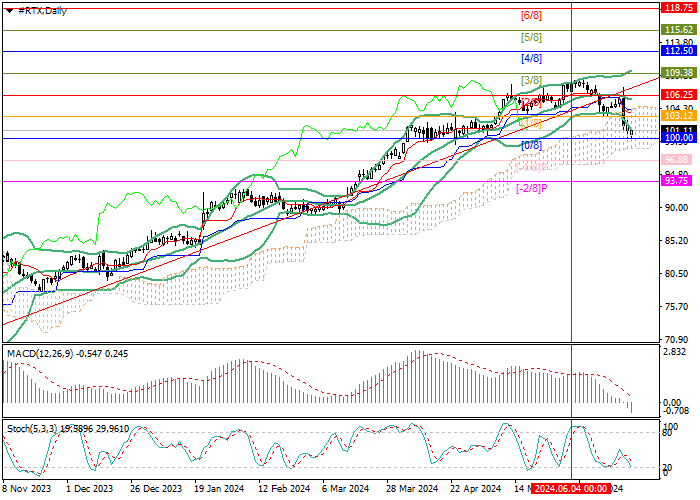
During the current month, shares of RTX Corp., an American aerospace and defense conglomerate, are adjusting to a long-term uptrend: the price reversed at 109.38 (Murrey level [3/8]) and fell to the lower limit of the Murrey trading range of 100.00 (Murrey level [0/8]), consolidating below which will allow quotes to continue to decline to the target of 93.75 (Murrey level [-2/8]). The key for the "bulls" is the level of 106.25 (Murrey level [2/8]), supported by the central line of Bollinger Bands, the breakout of which will ensure the resumption of growth towards the targets of 112.50 (Murrey level [4/8]) and 115.62 (Murrey level [5/8]).
Technical indicators confirm the possibility of continued decline: Bollinger Bands and Stochastic are reversing down, MACD is increasing in the negative zone.
Support and resistance
Resistance levels: 106.25, 112.50, 115.62.
Support levels: 100.00, 93.75.
Trading tips
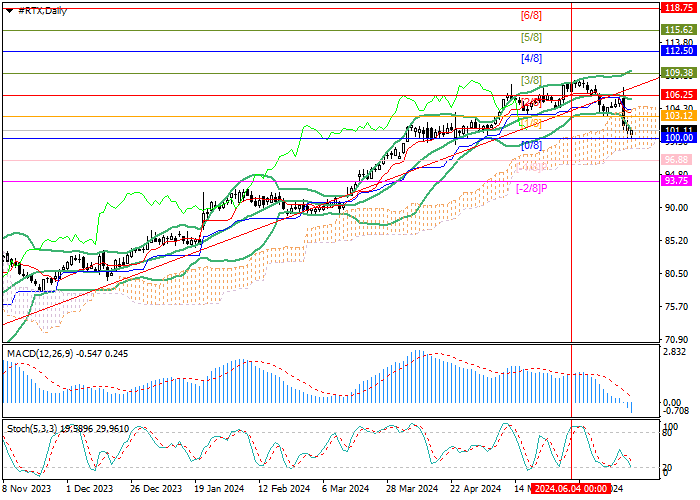
Short positions should be opened below the 100.00 mark with the target of 93.75 and stop-loss around 103.15. Implementation period: 5–7 days.
Long positions can be opened above the level of 106.25 with targets of 112.50, 115.62 and stop-loss around 102.30.