


| Scenario | |
|---|---|
| Timeframe | Weekly |
| Recommendation | BUY STOP |
| Entry Point | 5280.0 |
| Take Profit | 5420.0 |
| Stop Loss | 5240.0 |
| Key Levels | 5010.0, 5170.0, 5280.0, 5420.0 |
| Alternative scenario | |
|---|---|
| Recommendation | SELL STOP |
| Entry Point | 5170.0 |
| Take Profit | 5010.0 |
| Stop Loss | 5200.0 |
| Key Levels | 5010.0, 5170.0, 5280.0, 5420.0 |
Current trend
The leading US economy index S&P 500 is correcting at around 5226.0. After the publication of corporate reports ends, investors turn their attention to the bond market and macroeconomic statistics.
On Friday, a block of statistics from the University of Michigan was presented. According to forecasts for May, the US economy is expected to decline slightly: expected inflation was 3.5% instead of 3.2% previously, and the index of consumer inflation expectations for 5 years was raised to 3.1% from 3.0%. The Consumer Expectations Index fell to 66.5 points from 76.0 points, and the Consumer Sentiment Index fell to 67.4 points from 77.2 points, influencing the final data on the current conditions index, which dropped to 68.8 points from 79.0 points.
The situation on the bond market has somewhat stabilized: for the second week now, leading debt securities have not shown directional dynamics. The 10-year bonds are trading at 4.494%, almost identical to Friday's 4.492%, the 20-year bond yield was 4.740% after last week's 4.734%, and the 30-year bonds are trading at 4.640%, in line with the previous week's figure.
The growth leaders in the index are Mettler-Toledo International Inc. ( 17.25%), Gen Digital Inc. ( 15.34%), Arista Networks ( 6.09%), Charter Communications Inc. ( 4.40%).
Among the leaders of the decline are Akamai Technologies Inc. (-11.00%), Insulet Corp. (-6.55%), Moderna Inc. (-4.39%).
Support and resistance
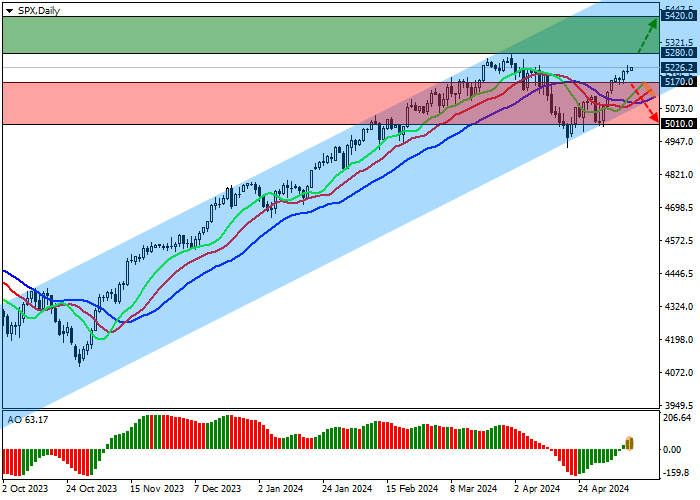
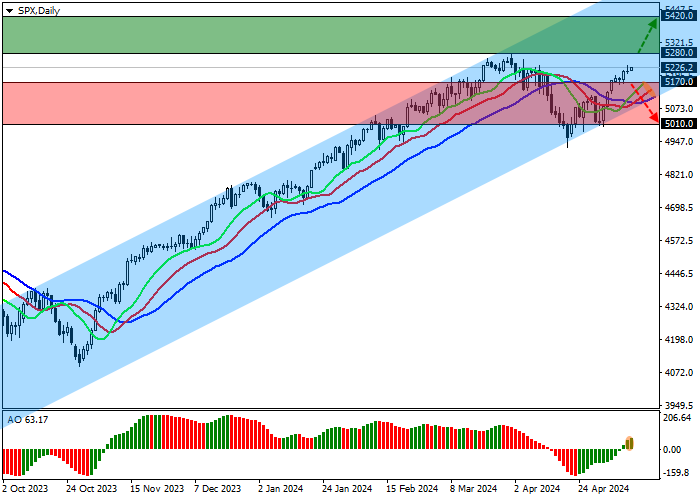
Index quotes continue to grow, moving in the direction of the resistance line of the channel with boundaries of 5500.0–5100.0 on the daily chart.
Technical indicators are holding a buy signal, which is actively strengthening: fast EMAs on the Alligator indicator are moving away from the signal line, and the AO histogram, being in the buy zone, is forming ascending bars.
Support levels: 5170.0, 5010.0.
Resistance levels: 5280.0, 5420.0.
Trading tips
If the asset continues to grow, and the price consolidates above the resistance level of 5280.0, buy positions with a target of 5420.0 will be relevant. Stop-loss — 5240.0. Implementation time: 7 days and more.
If the asset reverses and declines and the price consolidates below 5170.0, short positions can be opened with the target at 5010.0. Stop-loss — 5200.0.
إخلاء المسؤولية: الآراء الواردة هنا تعبر فقط عن رأي الكاتب، ولا تمثل الموقف الرسمي لـ Followme. لا تتحمل Followme مسؤولية دقة أو اكتمال أو موثوقية المعلومات المُقدمة، ولا تتحمل مسؤولية أي إجراءات تُتخذ بناءً على المحتوى، ما لم يُنص على ذلك صراحةً كتابيًا.

