
USD/JPY: WAVE ANALYSIS

avatar
· Views 113


USD/JPY: WAVE ANALYSIS
Scenario
TimeframeWeekly
RecommendationBUY
Entry Point156.38
Take Profit161.50, 165.00
Stop Loss151.73
Key Levels140.60, 146.41, 151.73, 161.50, 165.00
Alternative scenario
RecommendationSELL STOP
Entry Point151.70
Take Profit146.41, 140.60
Stop Loss153.45
Key Levels140.60, 146.41, 151.73, 161.50, 165.00

Growth is possible.

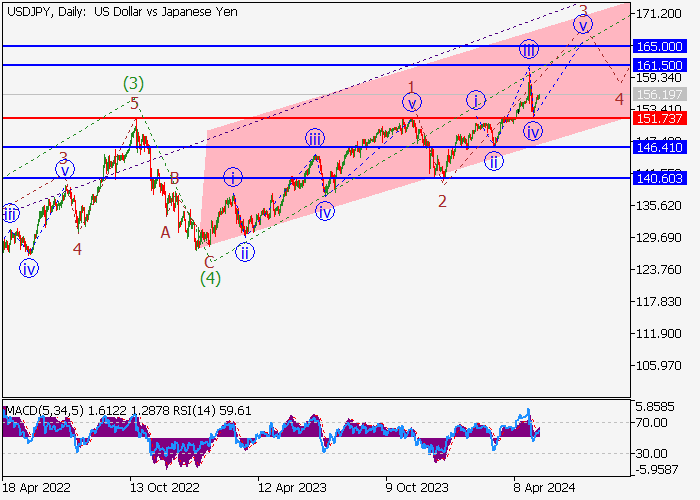
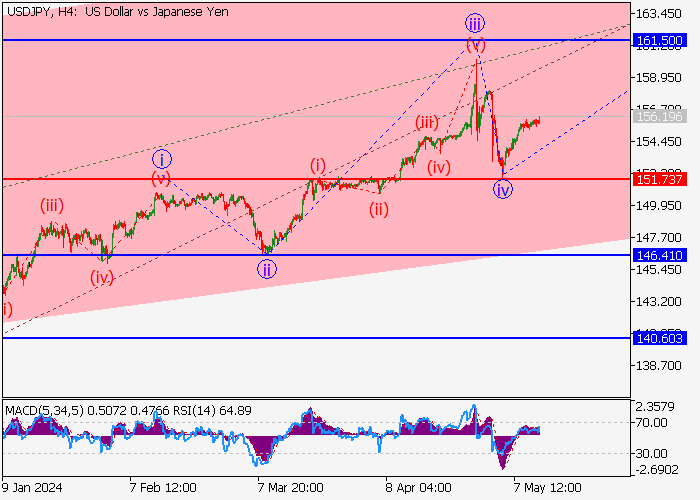
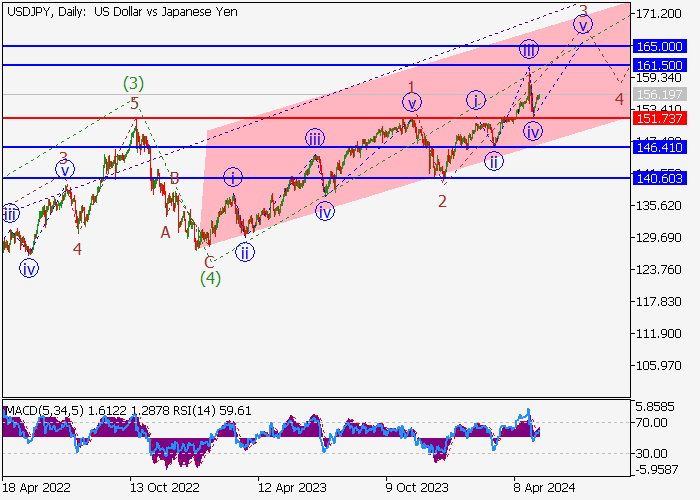
On the daily chart, the third wave of the higher level (3) formed, a downward correction ended as the fourth wave (4), and the fifth wave (5) develops, within which the wave 3 of (5) forms. Now, a local correction has formed as the fourth wave of the lower level iv of 3, and the fifth wave v of 3 is developing. If the assumption is correct, the USD/JPY pair will grow to the area of 161.50–165.00. In this scenario, critical stop loss level is 151.73.

USD/JPY: WAVE ANALYSIS

USD/JPY: WAVE ANALYSIS

Main scenario

Long positions will become relevant above the level of 151.73 with the targets at 161.50–165.00. Implementation period: 7 days and more.

Alternative scenario

A breakout and the consolidation of the price below the level of 151.73 will let the asset go down to the area of 146.41–140.60.


إخلاء المسؤولية: الآراء الواردة هنا تعبر فقط عن رأي الكاتب، ولا تمثل الموقف الرسمي لـ Followme. لا تتحمل Followme مسؤولية دقة أو اكتمال أو موثوقية المعلومات المُقدمة، ولا تتحمل مسؤولية أي إجراءات تُتخذ بناءً على المحتوى، ما لم يُنص على ذلك صراحةً كتابيًا.

هل أعجبك هذا المقال؟ عبّر عن امتنانك بإرسال نصيحة للكاتب.
الرد 0

  • tradingContest
