


| Scenario | |
|---|---|
| Timeframe | Weekly |
| Recommendation | BUY STOP |
| Entry Point | 351.05 |
| Take Profit | 372.00 |
| Stop Loss | 345.00 |
| Key Levels | 312.00, 337.00, 351.00, 372.00 |
| Alternative scenario | |
|---|---|
| Recommendation | SELL STOP |
| Entry Point | 336.95 |
| Take Profit | 312.00 |
| Stop Loss | 345.00 |
| Key Levels | 312.00, 337.00, 351.00, 372.00 |
Current trend
Shares of Caterpillar Inc., a manufacturer of construction and mining equipment, are adjusting at 345.00.
As part of the implementation of a cost-cutting policy, it was decided to delist the company's shares from two European exchanges: the departure from Euronext Paris is scheduled for May 28, and from the Swiss SIX Swiss Exchange it will take place before the end of 2024. Management notes that for several years in a row, trading volumes on these platforms were low and did not allow to compensate for the administrative costs associated with the quotation. Thus, the New York Stock Exchange (NYSE) will remain the only platform where asset trading will continue.
On April 25, Caterpillar Inc. released a financial report in which it reported revenue of 15.8 billion dollars, which was below both the 16.0 billion dollars forecast and 15.9 billion dollars over the same period a year earlier. Earnings per share (EPS) were 5.6 dollars, beating preliminary estimates of 5.14 dollars and 4.91 dollars last year.
On June 12, Caterpillar Inc. has scheduled an annual meeting of shareholders in a virtual format, during which the indexation of dividends for next year, as well as a possible share buyback program, will be discussed. The last payments for last year will take place on May 20, and their value will be 1.3 dollars per share, which is equivalent to a quarterly yield of 1.45%.
Support and resistance
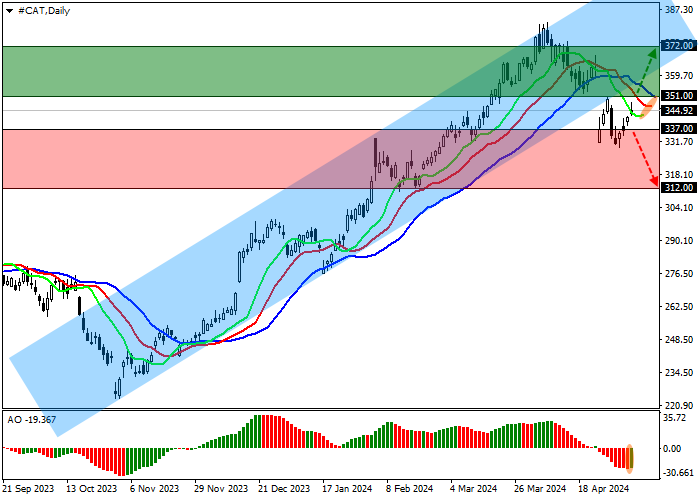
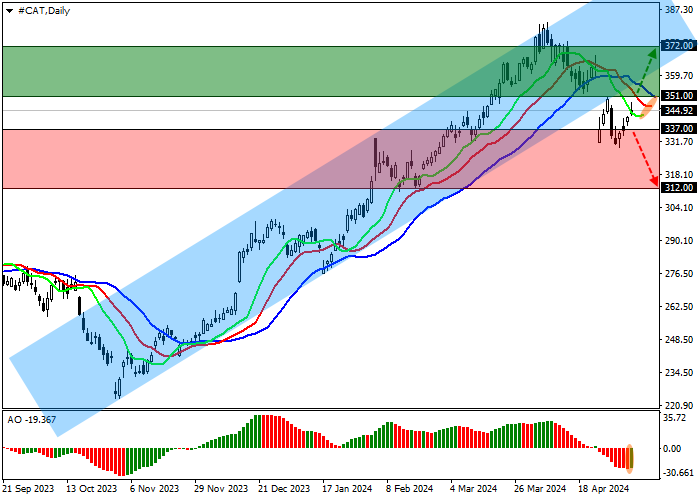
On the D1 chart, the asset continues to try to work out the recent price gap between 362.00–331.00 and is heading up.
Technical indicators hold the sell signal, which begins to reverse towards growth: the fast EMAs on the Alligator indicator are still below the signal line, and the AO histogram is trading in the sales zone.
Support levels: 337.00, 312.00.
Resistance levels: 351.00, 372.00.
Trading tips
If the local growth of the asset continues and the price consolidates above the resistance level of 351.00, one may open long positions with the target of 372.00 and stop-loss of 345.00. Implementation time: 7 days and more.
In case of a reversal and continued decline of the asset, as well as price consolidation below the support level of 337.00, one can open short positions with the target of 312.00 and stop-loss of 345.00.
إخلاء المسؤولية: الآراء الواردة هنا تعبر فقط عن رأي الكاتب، ولا تمثل الموقف الرسمي لـ Followme. لا تتحمل Followme مسؤولية دقة أو اكتمال أو موثوقية المعلومات المُقدمة، ولا تتحمل مسؤولية أي إجراءات تُتخذ بناءً على المحتوى، ما لم يُنص على ذلك صراحةً كتابيًا.

