


| Scenario | |
|---|---|
| Timeframe | Intraday |
| Recommendation | SELL STOP |
| Entry Point | 0.6000 |
| Take Profit | 0.5950 |
| Stop Loss | 0.6030 |
| Key Levels | 0.5920, 0.5950, 0.5975, 0.6000, 0.6030, 0.6047, 0.6082, 0.6100 |
| Alternative scenario | |
|---|---|
| Recommendation | BUY STOP |
| Entry Point | 0.6035 |
| Take Profit | 0.6082 |
| Stop Loss | 0.6000 |
| Key Levels | 0.5920, 0.5950, 0.5975, 0.6000, 0.6030, 0.6047, 0.6082, 0.6100 |
Current trend
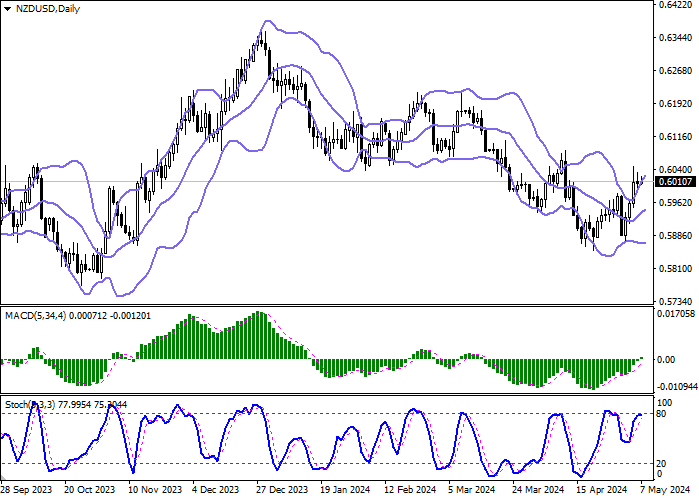
The NZD/USD pair is consolidating near 0.6010, and also remains in the area of local highs from April 10, updated at the end of last week. Pressure on the position of the American currency on Friday was exerted by the labor market report, which increased pressure on the US Federal Reserve regarding a possible reduction in borrowing costs in the near future.
American employers created only 175.0 thousand new jobs outside the agricultural sector, while markets expected 243.0 thousand, and in the previous month their number increased by 315.0 thousand. The Average Hourly Earnings adjusted from 0.3% to 0.2% in monthly terms and from 4.1% to 3.9% in annual terms, and the Unemployment Rate rose from 3.8% to 3.9%. Separately, investors drew attention to the sharp decline in the US Services PMI from the Institute for Supply Management (ISM) from 51.4 points to 49.4 points, with expectations at 52.0 points. These data strengthened investor confidence that the US Federal Reserve will soon begin to reduce borrowing costs this year, and experts are inclined to believe that it will be done twice, and the total value will be 50 basis points. Earlier, a member of the regulator's board, Michelle Bowman, said that inflation was likely to continue its downward trend, despite maintaining interest rates at current levels, and also confirmed the regulator's readiness to tighten monetary policy again if consumer prices stabilize above the target level of 2.0% or will continue to increase.
The day before, investors paid attention to the publication of data on the Chinese Services PMI: in April, the indicator adjusted from 52.7 points to 52.5 points, which can still be called a "bullish" factor. In New Zealand, the Commodity Price Index from the ANZ banking group was published, which is a leading indicator of export price inflation: the indicator added 0.5% after -1.3% in the previous month.
Support and resistance
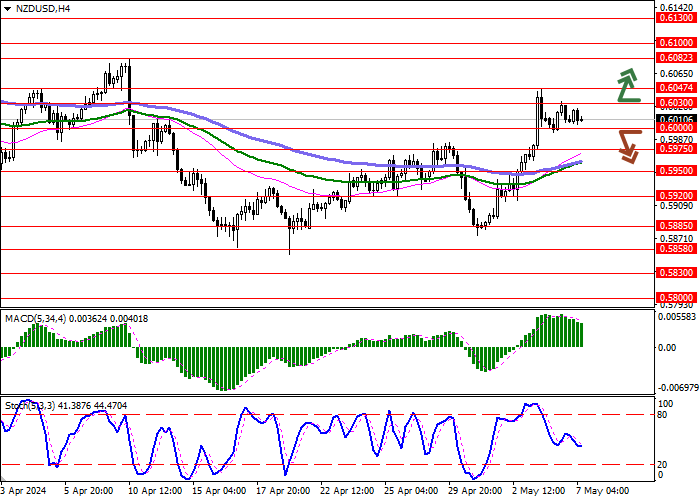
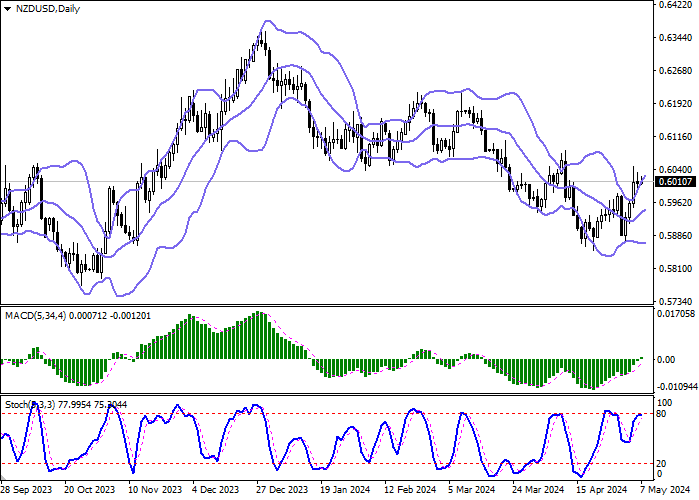
Bollinger Bands on the daily chart show a steady increase. The price range is expanding, but it fails to catch the development of "bullish" activity last week. MACD grows, preserving a stable buy signal (located above the signal line). The indicator is also trying to consolidate above the zero level. Stochastic, having approached the level of "80", reversed into the horizontal plane, indicating risks of overbought New Zealand dollar in the ultra-short term.
Resistance levels: 0.6030, 0.6047, 0.6082, 0.6100.
Support levels: 0.6000, 0.5975, 0.5950, 0.5920.
Trading tips
Short positions may be opened after a breakdown of 0.6000 with the target at 0.5950. Stop-loss — 0.6030. Implementation time: 1-2 days.
The return of the "bullish" trend with the breakout of 0.6030 may become a signal for new purchases with the target of 0.6082. Stop-loss — 0.6000.
إخلاء المسؤولية: الآراء الواردة هنا تعبر فقط عن رأي الكاتب، ولا تمثل الموقف الرسمي لـ Followme. لا تتحمل Followme مسؤولية دقة أو اكتمال أو موثوقية المعلومات المُقدمة، ولا تتحمل مسؤولية أي إجراءات تُتخذ بناءً على المحتوى، ما لم يُنص على ذلك صراحةً كتابيًا.

