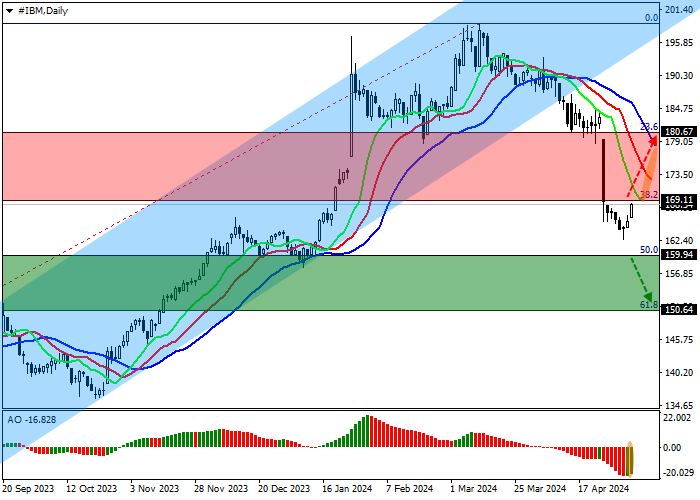
Shares of IBM Corp., a giant in the development and sale of hardware software, are trading at 168.00.
On the daily chart, the price moves away from the support line of the ascending corridor with dynamic boundaries of 200.00–184.00 and forms a new wave of decline.
On the four-hour chart, the quotes have overcome the core correction level of 38.2% Fibonacci 169.10 and are correcting upward, after which the completion of the reverse test of this level and the downward dynamics developing with overcoming the correction levels of 50.0% and 61.8% Fibonacci at 159.90 and 150.60 may follow.
Technical indicators hold a sell signal: fast EMA on the Alligator indicator move away from the signal line, expanding the range of fluctuations, and the AO histogram forms corrective bars, falling below the transition level.
Trading tips
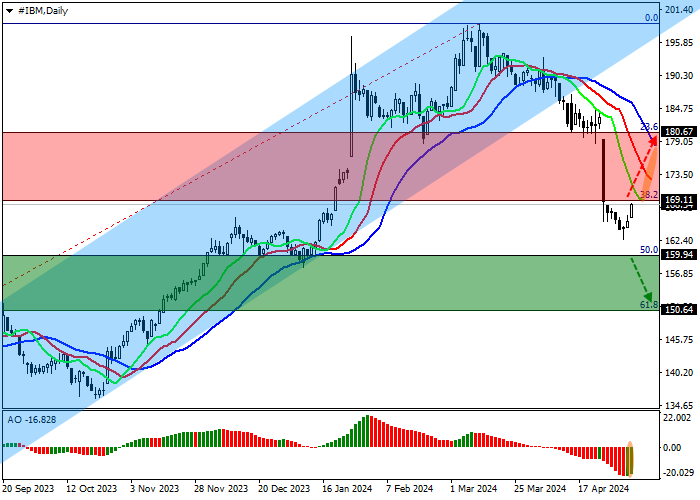
Short positions may be opened after the price declines and consolidates below 159.90, with the target at 150.60 and stop loss 163.00. Implementation period: 7 days or more.
Long positions may be opened after the price rises and consolidates above 169.10, with the target at 180.60. Stop loss – 165.00.