


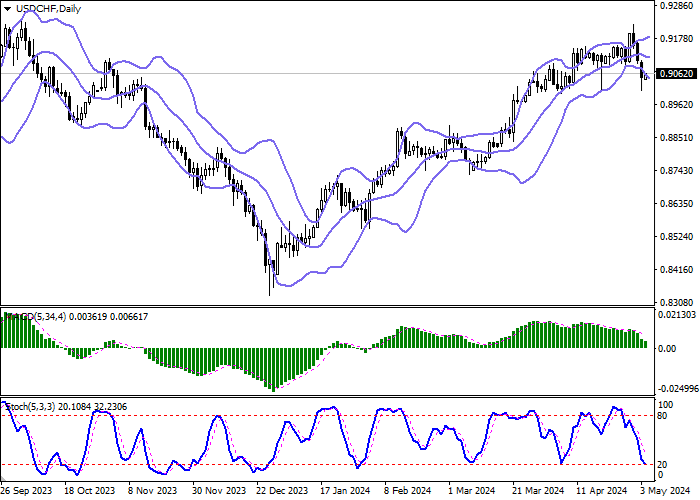
| Scenario | |
|---|---|
| Timeframe | Weekly |
| Recommendation | BUY STOP |
| Entry Point | 0.9075 |
| Take Profit | 0.9130 |
| Stop Loss | 0.9037 |
| Key Levels | 0.8935, 0.8964, 0.9000, 0.9037, 0.9071, 0.9100, 0.9130, 0.9150 |
| Alternative scenario | |
|---|---|
| Recommendation | SELL STOP |
| Entry Point | 0.9035 |
| Take Profit | 0.8964 |
| Stop Loss | 0.9071 |
| Key Levels | 0.8935, 0.8964, 0.9000, 0.9037, 0.9071, 0.9100, 0.9130, 0.9150 |
Current trend
During the Asian session, the USD/CHF pair is growing slightly, testing the level of 0.9060 for a breakout. Activity in the market remains restrained, and investors analyze the American statistics published on Friday.
In April, nonfarm payrolls decreased from 315.0K to 175.0K, significantly below expectations of 243.0K, the increase in average hourly wages slowed from 0.3% to 0.2% MoM and from 4.1% to 3.9% YoY, respectively, and the unemployment rate changed from 3.8% to 3.9%. Despite some cooling of the labor market, it remains strong, given the restrictive nature of the US Fed’s monetary policy, and investors are adjusting the expected timing of interest rate cuts amid high inflation in the country.
Annual inflation in Switzerland accelerated faster than expected in April, data from the Federal Statistical Office showed, although economists said they still expect the Swiss National Bank (SNB) to continue adjusting borrowing costs: the consumer price index rose from 1.0% to 1.4% YoY, exceeding the forecast of 1.1%, and by 0.3% compared to estimates of 0.1% MoM. Analysts believe that since energy prices are falling and demand for services in the domestic market remains poor, the regulator may begin easing monetary policy as early as the June meeting. On Monday, investors will focus on the speech of the head of the department, Thomas Jordan, who may comment on the further actions of the SNB. Tomorrow at 07:45 (GMT 2) data on unemployment in April is due: preliminary estimates suggest an increase in the figure by the previous 2.3%.
Support and resistance
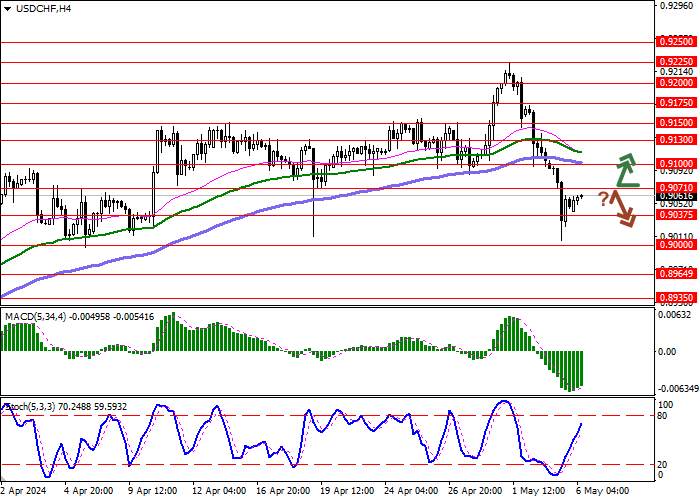
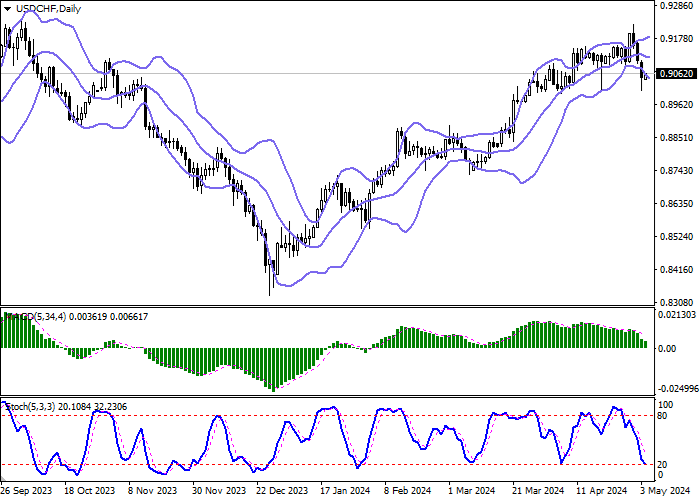
On the daily chart, Bollinger bands are trying to reverse horizontally: the price range is expanding from below, letting the “bears” renew their lows. The MACD indicator is declining, maintaining a strong sell signal: the histogram is below the signal line. Stochastic is approaching the oversold area, reflecting that the American dollar may become oversold in the ultra-short term.
Resistance levels: 0.9071, 0.9100, 0.9130, 0.9150.
Support levels: 0.9037, 0.9000, 0.8964, 0.8935.
Trading tips
Long positions may be opened after a breakout of 0.9071, with the target at 0.9130. Stop loss – 0.9037. Implementation time: 2–3 days.
Short positions may be opened after a rebound from 0.9071 and a breakdown of 0.9037, with the target at 0.8964. Stop loss – 0.9071.
إخلاء المسؤولية: الآراء الواردة هنا تعبر فقط عن رأي الكاتب، ولا تمثل الموقف الرسمي لـ Followme. لا تتحمل Followme مسؤولية دقة أو اكتمال أو موثوقية المعلومات المُقدمة، ولا تتحمل مسؤولية أي إجراءات تُتخذ بناءً على المحتوى، ما لم يُنص على ذلك صراحةً كتابيًا.

