


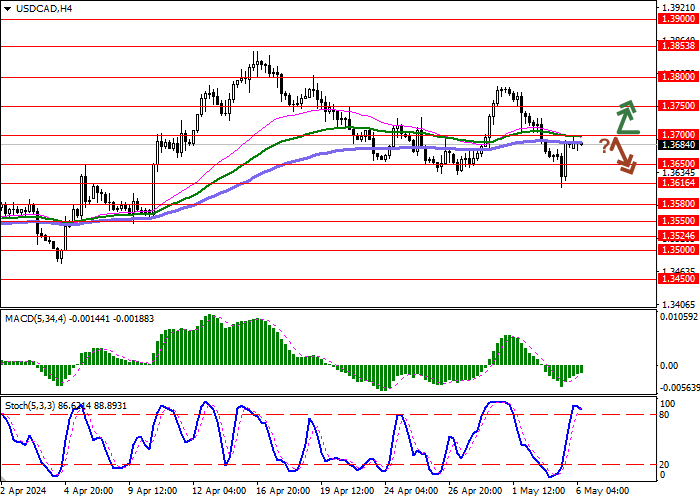
| Scenario | |
|---|---|
| Timeframe | Intraday |
| Recommendation | BUY STOP |
| Entry Point | 1.3700 |
| Take Profit | 1.3800 |
| Stop Loss | 1.3650 |
| Key Levels | 1.3550, 1.3580, 1.3616, 1.3650, 1.3700, 1.3750, 1.3800, 1.3853 |
| Alternative scenario | |
|---|---|
| Recommendation | SELL STOP |
| Entry Point | 1.3650 |
| Take Profit | 1.3550 |
| Stop Loss | 1.3700 |
| Key Levels | 1.3550, 1.3580, 1.3616, 1.3650, 1.3700, 1.3750, 1.3800, 1.3853 |
Current trend
The USD/CAD pair shows a restrained growth in the area of 1.3676, developing a "bullish" impetus formed at the end of last week, when the instrument updated local lows of April 10. The pressure on the American currency was provided by April data on the labor market.
The national economy created only 175.0 thousand new jobs outside the agricultural sector after 315.0 thousand in the previous month, while analysts counted on 243.0 thousand, the Average Hourly Earnings slowed down from 0.3% to 0.2% In monthly terms and from 4.1% to 3.9% in annual terms, and the Unemployment Rate was adjusted from 3.8% to 3.9%. An additional negative factor was a sharp decrease in the Services PMI from the Institute of Supply Management (ISM) from 51.4 points to 49.4 points with the expectations at 52.0 points.
In turn, the Canadian report on the labor market will be presented on Friday, May 10. Experts suggest that the Net Change in Employment in April will grow by 17.5 thousand after -2.2 thousand in the previous month, the Average Hourly Wages will slow down from the previous growth by 5.0%, and the Unemployment Rate will adjust from 6.1% to 6.2%.
The Bank of Canada Governor Tiff Macklem, answering the question about the impact of decisions of the US monetary authorities on the national course of monetary policy, emphasized that there is a limit of how the approaches may disperse, while noting that the basic interest rate that remains at the level of 5.00% does not have to correspond to the position of world regulators. Nevertheless, experts believe that the gap between the indicators in Canada and the United States can weaken the exchange rate between national currencies, since investors seek income from a higher interest rate.
Support and resistance
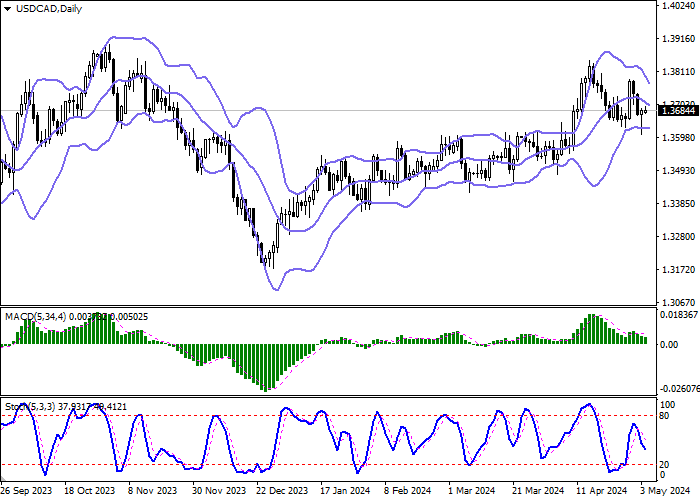
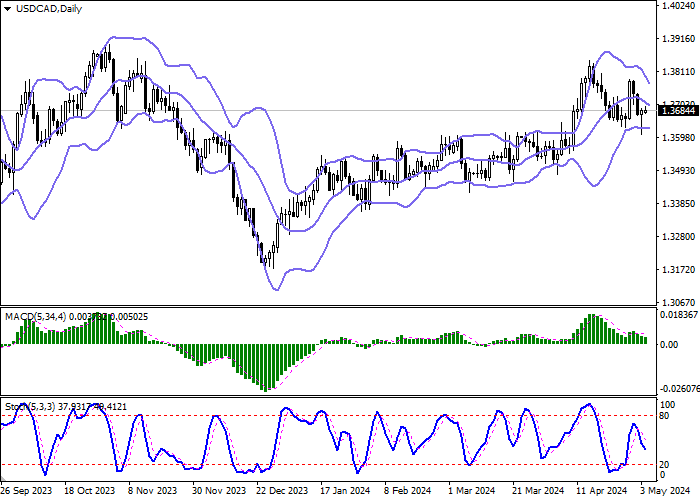
On the D1 chart Bollinger Bands are sharply reversing into a downward plane. The price range is narrowing from above, reflecting the emergence of ambiguous dynamics in the short term. MACD is falling, keeping a relatively strong sell signal (the histogram is below the signal line). Stochastic demonstrates similar dynamics, but is rapidly approaching its lows, pointing to the growing risks of the oversold American currency in the ultra-short term.
Resistance levels: 1.3700, 1.3750, 1.3800, 1.3853.
Support levels: 1.3650, 1.3616, 1.3580, 1.3550.
Trading tips
Long positions may be opened after a breakout of 1.3700 with the target at 1.3800. Stop-loss — 1.3650. Implementation time: 2-3 days.
A rebound from 1.3700 as from resistance, followed by a breakdown of 1.3650 may become a signal for opening of new short positions with the target at 1.3550. Stop-loss — 1.3700.
إخلاء المسؤولية: الآراء الواردة هنا تعبر فقط عن رأي الكاتب، ولا تمثل الموقف الرسمي لـ Followme. لا تتحمل Followme مسؤولية دقة أو اكتمال أو موثوقية المعلومات المُقدمة، ولا تتحمل مسؤولية أي إجراءات تُتخذ بناءً على المحتوى، ما لم يُنص على ذلك صراحةً كتابيًا.

