


| Scenario | |
|---|---|
| Timeframe | Weekly |
| Recommendation | BUY STOP |
| Entry Point | 0.9235 |
| Take Profit | 0.9420, 0.9510 |
| Stop Loss | 0.9190 |
| Key Levels | 0.8795, 0.8890, 0.9005, 0.9230, 0.9420, 0.9510 |
| Alternative scenario | |
|---|---|
| Recommendation | SELL STOP |
| Entry Point | 0.9000 |
| Take Profit | 0.8890, 0.8795 |
| Stop Loss | 0.9090 |
| Key Levels | 0.8795, 0.8890, 0.9005, 0.9230, 0.9420, 0.9510 |
USD/CHF, D1
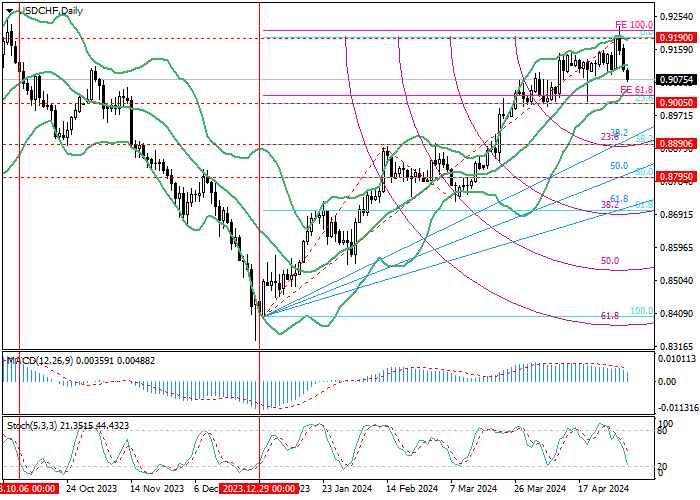
On the daily chart, the price is growing as part of the medium-term upward trend: this week, it renewed the annual high of 0.9220 and began a correction. If 0.9005 (23.6% correction) is broken, the quotes can reach the area of 0.8890 (38.2% correction) and 0.8795 (50.0% correction), for which they will need to overcome the lines of the ascending fan. A breakout of the key “bullish” level of 0.9190 (0.0% correction) will lead to growth to 0.9510 (Fibonacci extension 161.8%).
Technical indicators confirm the continuation of the upward trend: Bollinger bands are directed upwards, the MACD histogram is decreasing in the positive zone, and Stochastic is directed downward, approaching the oversold zone, which reflects the likelihood of a reversal.
USD/CHF, W1
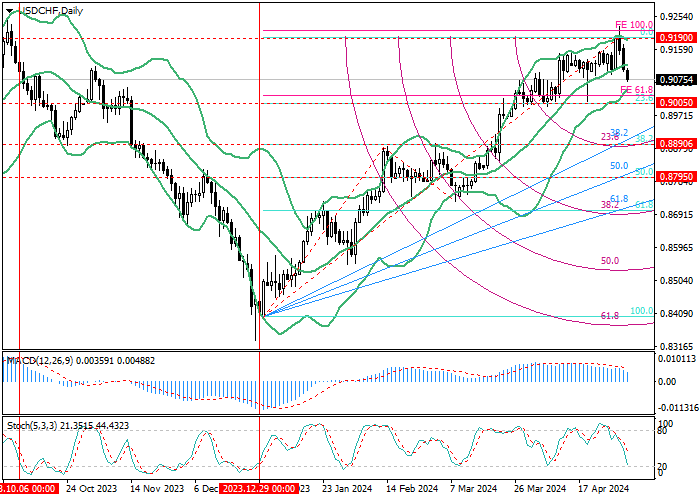
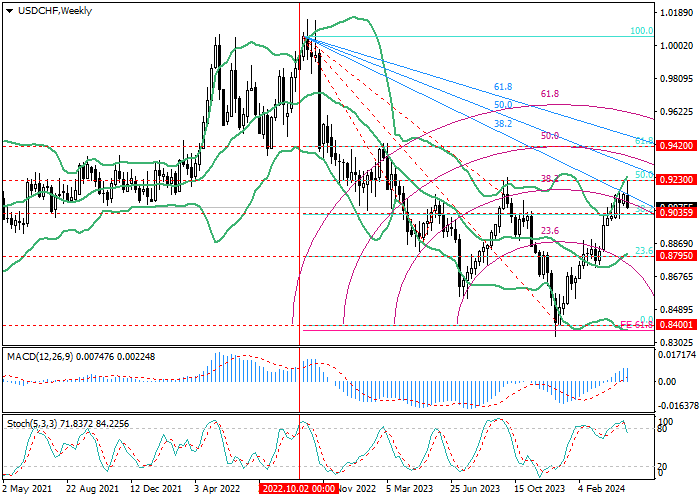
On the weekly chart, the asset is correcting to the long-term downward trend: the quotes reversed at 0.8400 (correction 0.0%), and this week, it approached 0.9230 (correction 50.0%). Its breakout will allow the price to reach 0.9420 (correction 61.8 %), which will require breaking through the downward fan. After consolidation below 0.9035 (correction of 38.2%), the decline can continue to 0.8795 (correction of 23.6%, the middle line of Bollinger bands).
Technical indicators do not give a single signal: Bollinger bands reverse upwards, the MACD histogram is increasing in the positive zone, but Stochastic is leaving the overbought zone, which does not exclude a decline.
Support and resistance
Soon, the continued growth of the trading instrument seems more likely. After a breakout of the level 0.9230 (50.0% correction, W1), the growth targets will be 0.9420 (61.8% correction, W1) and 0.9510 (Fibonacci extension 161.8%, D1). After a breakdown of 0.9005 (23.6% correction, D1), the negative dynamics will resume to 0.8890 (38.2% correction, D1), 0.8795 (23.6% correction, the middle line of Bollinger Bands, W1, correction 50,0%, D1).
Resistance levels: 0.9230, 0.9420, 0.9510.
Support levels: 0.9005, 0.8890, 0.8795.
Trading tips
Long positions may be opened above 0.9230, with the targets at 0.9420, 0.9510, and stop loss 0.9190. Implementation time: 5–7 days.
Short positions may be opened below 0.9005, with the targets at 0.8890, 0.8795, and stop loss of 0.9090.
إخلاء المسؤولية: الآراء الواردة هنا تعبر فقط عن رأي الكاتب، ولا تمثل الموقف الرسمي لـ Followme. لا تتحمل Followme مسؤولية دقة أو اكتمال أو موثوقية المعلومات المُقدمة، ولا تتحمل مسؤولية أي إجراءات تُتخذ بناءً على المحتوى، ما لم يُنص على ذلك صراحةً كتابيًا.

