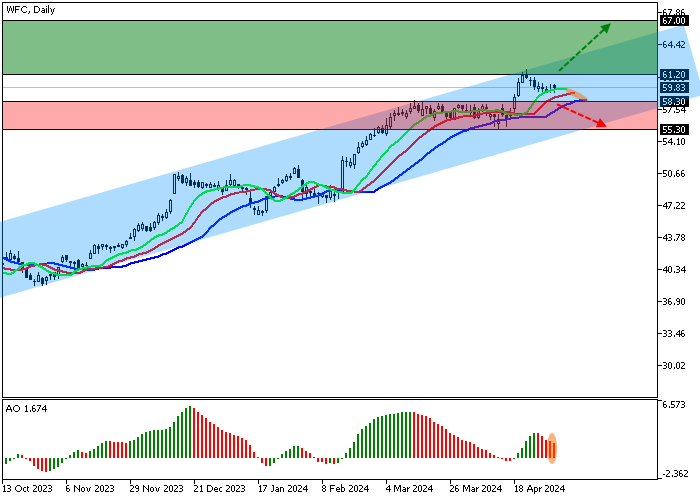
Shares of Wells Fargo & Co., one of the leading banking and insurance companies in the United States, are corrected at 60.00.
On the daily chart, the price stays within the ascending corridor of 64.00–56.00.
On the four-hour chart, the quotes reached the channel resistance line of 61.50 and began to form a corrective Flag pattern with an implementation level of 61.20, and if implemented, the asset could reach 67.00.
Technical indicators are weakening the buy signal: fast EMA of the Alligator indicator are above the signal line, narrowing the range of fluctuations, and the AO histogram is forming corrective bars above the transition level.
Trading tips
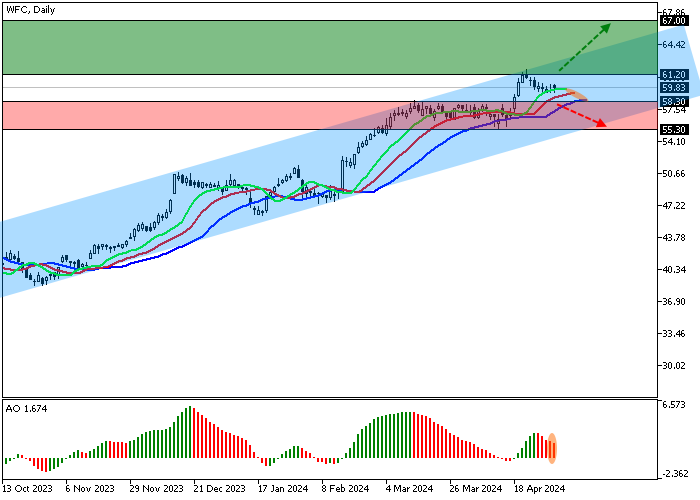
Long positions may be opened after the price rises and consolidates above 61.20, with the target at 67.00. Stop loss – 60.00. Implementation period: 7 days or more.
Short positions may be opened after the price declines and consolidates below 58.30, with the target at 55.30. Stop loss – 60.00.