Current trend
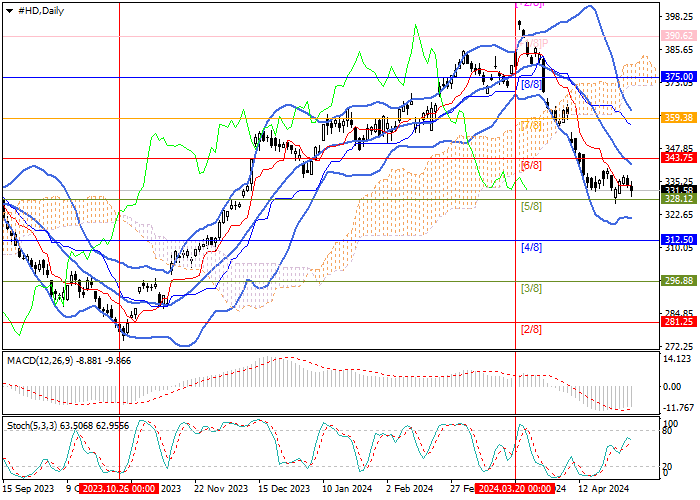
Shares of The Home Depot Inc., the largest home improvement company, resumed their decline in mid-March, correcting to a long-term upward trend. During this time, the price reversed at 390.62 (Murrey level [ 1/8]), returning to the main Murrey trading range and is now testing 328.12 (Murrey level [5/8]), consolidation below which will lead to a decline around 312.50 (Murrey level [4/8]), 296.88 (Murrey level [3/8]) and 281.25 (Murrey level [2/8]). A reverse breakout of the pivot level of 343.75 will allow the quotes to return to the upper limit of the trading range at 375.00 (Murrey level [8/8]).
Technical indicators maintain a sell signal: Bollinger Bands are directed downwards, and the MACD histogram is stable in the negative zone. Stochastic is directed upward but is close to the overbought zone, which reflects the likelihood of a reversal.
Support and resistance
Resistance levels: 343.75, 375.00.
Support levels: 328.12, 312.50, 296.88, 281.25.
Trading tips
Short positions may be opened below 328.12, with the targets at 312.50, 296.88, 281.25, and stop loss 339.00. Implementation time: 5–7 days.
Long positions may be opened above 343.75, with the target at 375.00 and stop loss 332.00.