


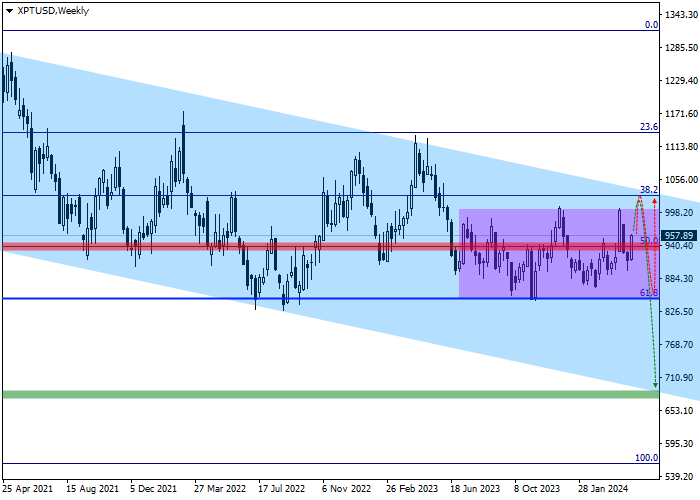
We present a medium-term investment review of the XPT/USD pair.
Industrial metals, which recently include platinum and palladium, develop downward dynamics, in contrast to precious metals, which investors continue to view as the best way to hedge risks. Thus, the narrowing of the gap in the spread with other instruments and, in particular, #PA confirms that the demand for the asset from investors has remained almost unchanged. The exchange of positions in favor of platinum took place on February 8, and now it is trading by 6.0 dollars higher than its main competitor. Since the beginning of March, the price gap between them has increased to 46.0 dollars in favor of #XPT but then narrowed to the current value. The active dynamics in the conservative instrument are favorable for short-term operations that negatively affect the global trend. Thus, until the spread between metals stabilizes again, the dynamics will stay the same.
As for the demand for physical metal, the World Platinum Investment Council (WPIC) expects the market to remain in a deficit of approximately 353.0K ounces in 2024, although demand from enterprises will decline moderately, reaching –5.0%. Supply could rise to 7.310K ounces due to an expected 2.0% increase in production this year. The main driver of demand remains consumption from the automotive industry, which may decline to 3.312K ounces this year due to insufficient growth in the substitution of palladium with platinum, which reached 700.0K ounces compared to 620.0K ounces previously.
The distribution of contracts also puts pressure on the quotes: according to the latest report from the US Commodity Futures Trading Commission (CFTC), the number of purchase transactions among producers was 3.195K, and of sale – 26.246K, which is unlikely to change soon.
In addition to the underlying fundamental factors, the strengthening of downward dynamics is confirmed by technical indicators: on the weekly chart, the price is moving within the downward channel with dynamic boundaries of 1050.0–700.0, confidently holding in the middle of the range.
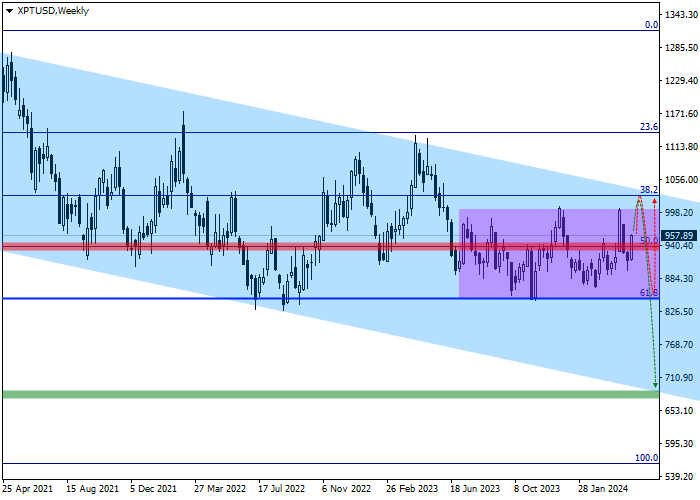
The price is testing the intermediate correction level of 50.0% Fibonacci 940.00 between local corrective growth and global decline. If it consolidates above it, the asset may reach the core correction level of 38.2% Fibonacci 1030.00, coinciding with the channel resistance line, where a reversal will occur.
Let’s consider key levels on the daily chart.
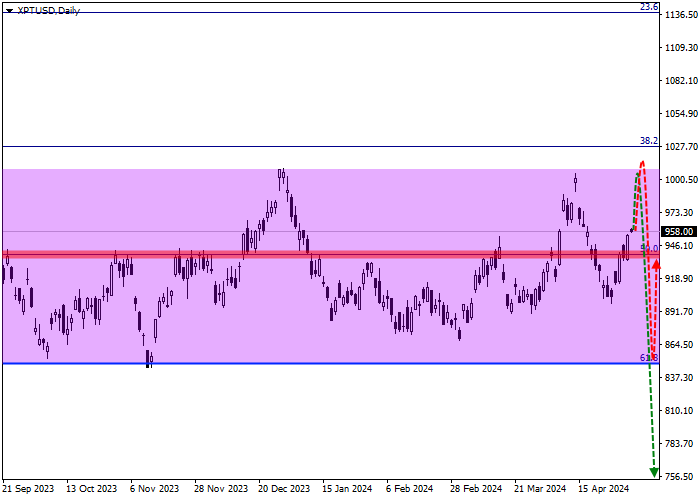
As can be seen on the chart, the current movement is developing within a sideways range between the correction levels of 38.2% and 61.8% (850.00), which acts as a mark for the beginning of negative dynamics.
In the event of a price reversal at the 61.8% level and reaching 940.00, which coincides with the 50.0% Fibonacci level, it is better to liquidate open sell positions. Around the support line of the global downward channel of 680.00, there is the target zone. After reaching, it is better to take profits on open sell positions.
Let’s assess entry levels on the four-hour chart.
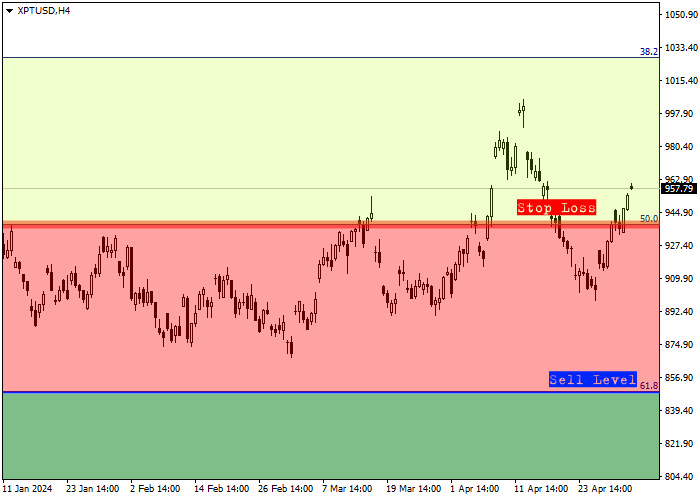
The entry level for sell transactions is at 850.00, which coincides with the full correction of 61.8% Fibonacci, and it may take sufficient time to receive a signal to enter the market. The price will break the November low, with no significant support left on the way to the target level of 680.00, and it is better to implement the positions.
Given the average daily volatility of the trading instrument over the past month of 1273.0 points, a movement to the target zone of 680.00 could take approximately 59 trading sessions. With increasing volatility in metals, it may reduce to 39 trading days.
إخلاء المسؤولية: الآراء الواردة هنا تعبر فقط عن رأي الكاتب، ولا تمثل الموقف الرسمي لـ Followme. لا تتحمل Followme مسؤولية دقة أو اكتمال أو موثوقية المعلومات المُقدمة، ولا تتحمل مسؤولية أي إجراءات تُتخذ بناءً على المحتوى، ما لم يُنص على ذلك صراحةً كتابيًا.

