


| Scenario | |
|---|---|
| Timeframe | Intraday |
| Recommendation | BUY STOP |
| Entry Point | 1.0765 |
| Take Profit | 1.0850 |
| Stop Loss | 1.0720 |
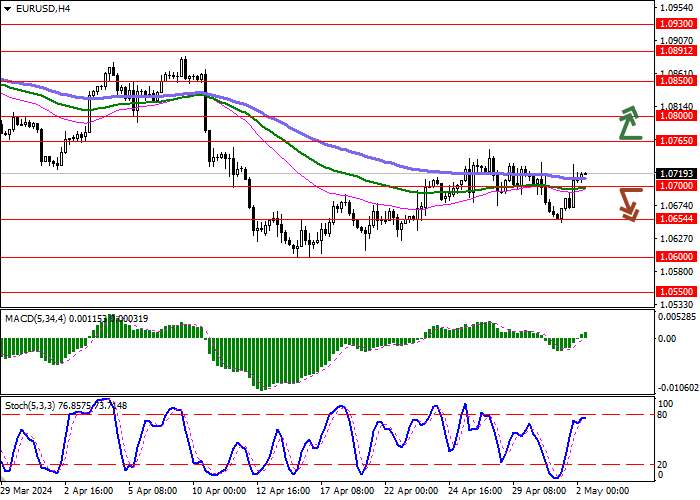
| Key Levels | 1.0550, 1.0600, 1.0654, 1.0700, 1.0765, 1.0800, 1.0850, 1.0891 |
| Alternative scenario | |
|---|---|
| Recommendation | SELL STOP |
| Entry Point | 1.0700 |
| Take Profit | 1.0600 |
| Stop Loss | 1.0750 |
| Key Levels | 1.0550, 1.0600, 1.0654, 1.0700, 1.0765, 1.0800, 1.0850, 1.0891 |
Current trend
The EUR/USD pair shows multidirectional dynamics, consolidating around 1.0940: activity in the market remains restrained, despite the publication of key macroeconomic statistics.
On Tuesday, the focus of investors' attention was on the eurozone's Gross Domestic Product (GDP) data for the first quarter, which turned out to be better than analysts' expectations, but the euro showed a fairly active decline that day. One way or another, the region’s economy added 0.4% in annual terms after growing by 0.1% in the previous reporting period, while analysts expected 0.2%, and in quarterly terms the figure accelerated from 0.0% to 0.3%, ahead of the forecast of 0.1%. In addition, trading participants paid attention to April inflation statistics: the Core Consumer Price Index in annual terms slowed down from 2.9% to 2.7%, while experts expected 2.6%, and in monthly terms it declined from 1.1% to 0.7%.
The day before, the market's focus shifted to data from the United States. The Manufacturing PMI from the Institute for Supply Management (ISM) dropped from 50.3 points to 49.2 points in April, with expectations of 50.0 points, and a report from Automatic Data Processing (ADP) on employment in the private sector reflected a slight decrease in the indicator from 208.0 thousand to 192.0 thousand, while analysts expected 175.0 thousand.
Yesterday's trading session ended with the results of the US Federal Reserve meeting: as expected, officials kept the interest rate at 5.50% for the sixth time in a row, citing the inflation rate as not being low enough to implement a looser monetary policy. Moreover, commenting on the decision, the Fed's Chair Jerome Powell noted that the regulator is currently not confident that the rate of decline in consumer prices will reach target values in the near future.
Support and resistance
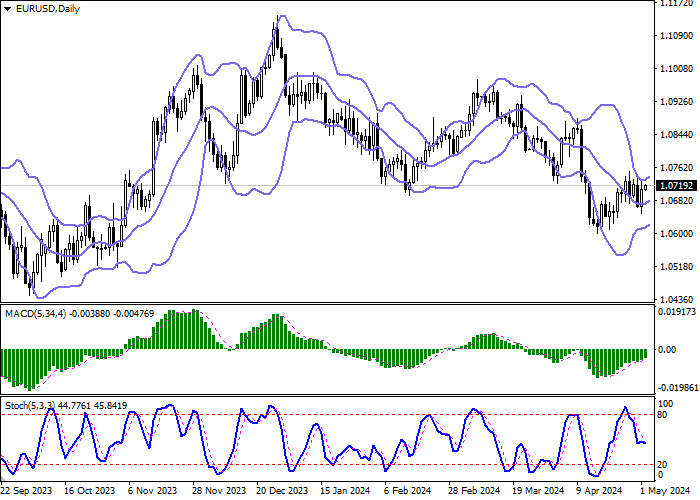
On the D1 chart Bollinger Bands are reversing into the ascending plane. The price range is slightly changing, being spacious enough for the current activity level in the market. MACD indicator is growing, while preserving a rather stable buy signal (located above the signal line). Stochastic remains horizontal, located approximately in the center of its area, which indicates a balance of power in the ultra-short term.
Resistance levels: 1.0765, 1.0800, 1.0850, 1.0891.
Support levels: 1.0700, 1.0654, 1.0600, 1.0550.
Trading tips
Long positions can be opened after a breakout of 1.0765 with the target of 1.0850. Stop-loss — 1.0720. Implementation time: 2-3 days.
The breakdown of 1.0700 may serve as a signal to open short positions with the target at 1.0600. Stop-loss — 1.0750.
إخلاء المسؤولية: الآراء الواردة هنا تعبر فقط عن رأي الكاتب، ولا تمثل الموقف الرسمي لـ Followme. لا تتحمل Followme مسؤولية دقة أو اكتمال أو موثوقية المعلومات المُقدمة، ولا تتحمل مسؤولية أي إجراءات تُتخذ بناءً على المحتوى، ما لم يُنص على ذلك صراحةً كتابيًا.

