


| Scenario | |
|---|---|
| Timeframe | Weekly |
| Recommendation | SELL STOP |
| Entry Point | 1.0640 |
| Take Profit | 1.0559, 1.0498 |
| Stop Loss | 1.0700 |
| Key Levels | 1.0498, 1.0498, 1.0645, 1.0742, 1.0864, 1.0945 |
| Alternative scenario | |
|---|---|
| Recommendation | BUY STOP |
| Entry Point | 1.0745 |
| Take Profit | 1.0864, 1.0945 |
| Stop Loss | 1.0670 |
| Key Levels | 1.0498, 1.0498, 1.0645, 1.0742, 1.0864, 1.0945 |
Current trend
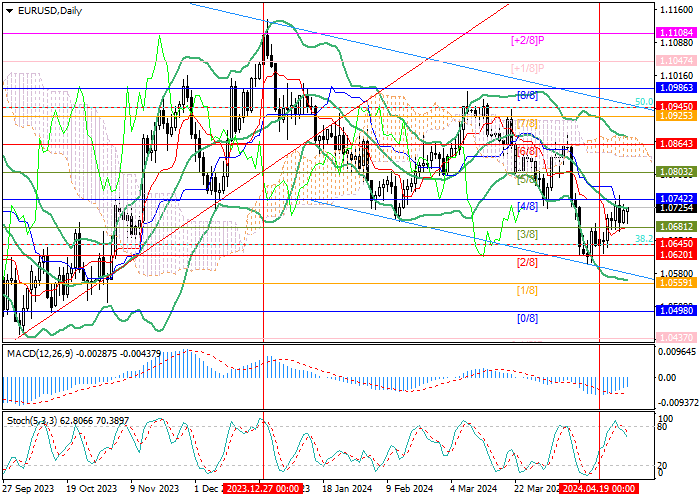
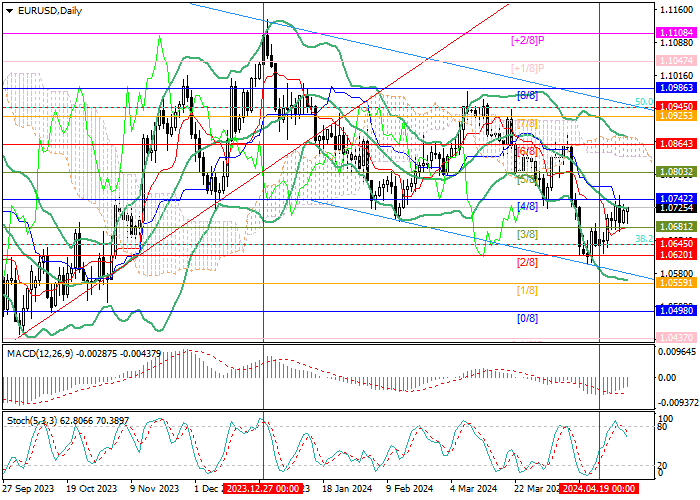
The EUR/USD pair is moving within a long-term downward channel: in the middle of the month, the price reached its lower limit of 1.0600 and corrected to the middle line of Bollinger Bands 1.0725, where it is now trading.
Despite the corrective growth, the overall fundamental background favors the continuation of the downward trend: investors expect a significant divergence in the further actions officials of the European Central Bank (ECB) and the US Fed, which in the medium term supports the dollar and puts pressure on the euro. It is assumed that the European regulator will begin reducing interest rates in June and the American regulator no earlier than September. The determination of EU economists to ease monetary policy is supported by the latest data on inflation and gross domestic product (GDP): in April, the consumer price index remained at 2.4% YoY, and the core indicator fell from 2.9% to 2.7 %, falling short of forecasts of 2.6%. The Q1 value exceeded preliminary estimates, amounting to 0.3% instead of 0.1% QoQ and 0.4% instead of 0.2% YoY. Thus, the region’s economy is recovering, and inflationary pressure is weakening, creating the preconditions for reducing borrowing costs.
Meanwhile, US Fed officials are taking a more cautious position: since the beginning of the year, inflation in the country has resumed growth, reaching 3.5% in March, moving away from the target level of 2.0%. At the same time, the economy is slowing, growing by 1.6% in the first quarter instead of the expected 2.5%, so the likelihood of maintaining the “hawkish” course for a long time increases. Investors believe that at a meeting on Wednesday, the department will confirm the delay of the transition to monetary policy easing to September, and the most pessimistic experts expect hints of an increase in the indicator this year, which could put pressure on the EUR/USD pair.
Support and resistance
The trading instrument is around the middle line of Bollinger Bands: if it breaks upward and reaches 1.0742 (Murrey level [4/8]), the price may rise to targets 1.0864 (Murrey level [6/8]) and 1.0945 (Fibonacci correction 50.0%). A consolidation below the key “bearish” level at 1.0645 (Fibonacci correction 38.2%) will allow the quotes to fall to the area of 1.0559 (Murrey level [1/8]) and 1.0498 (Murrey level [0/8]).
Technical indicators confirm the continuation of the downward trend: Bollinger Bands and Stochastic are directed downwards, and the MACD histogram is decreasing in the negative zone.
Resistance levels: 1.0742, 1.0864, 1.0945.
Support levels: 1.0645, 1.0559, 1.0498.
Trading tips
Short positions may be opened below 1.0645, with the targets at 1.0559, 1.0498, and stop loss 1.0700. Implementation time: 5–7 days.
Long positions may be opened above 1.0742, with the targets at 1.0864, 1.0945, and stop loss 1.0670.
إخلاء المسؤولية: الآراء الواردة هنا تعبر فقط عن رأي الكاتب، ولا تمثل الموقف الرسمي لـ Followme. لا تتحمل Followme مسؤولية دقة أو اكتمال أو موثوقية المعلومات المُقدمة، ولا تتحمل مسؤولية أي إجراءات تُتخذ بناءً على المحتوى، ما لم يُنص على ذلك صراحةً كتابيًا.

